From School-Wide Trends to a Single Student: A Principal's View
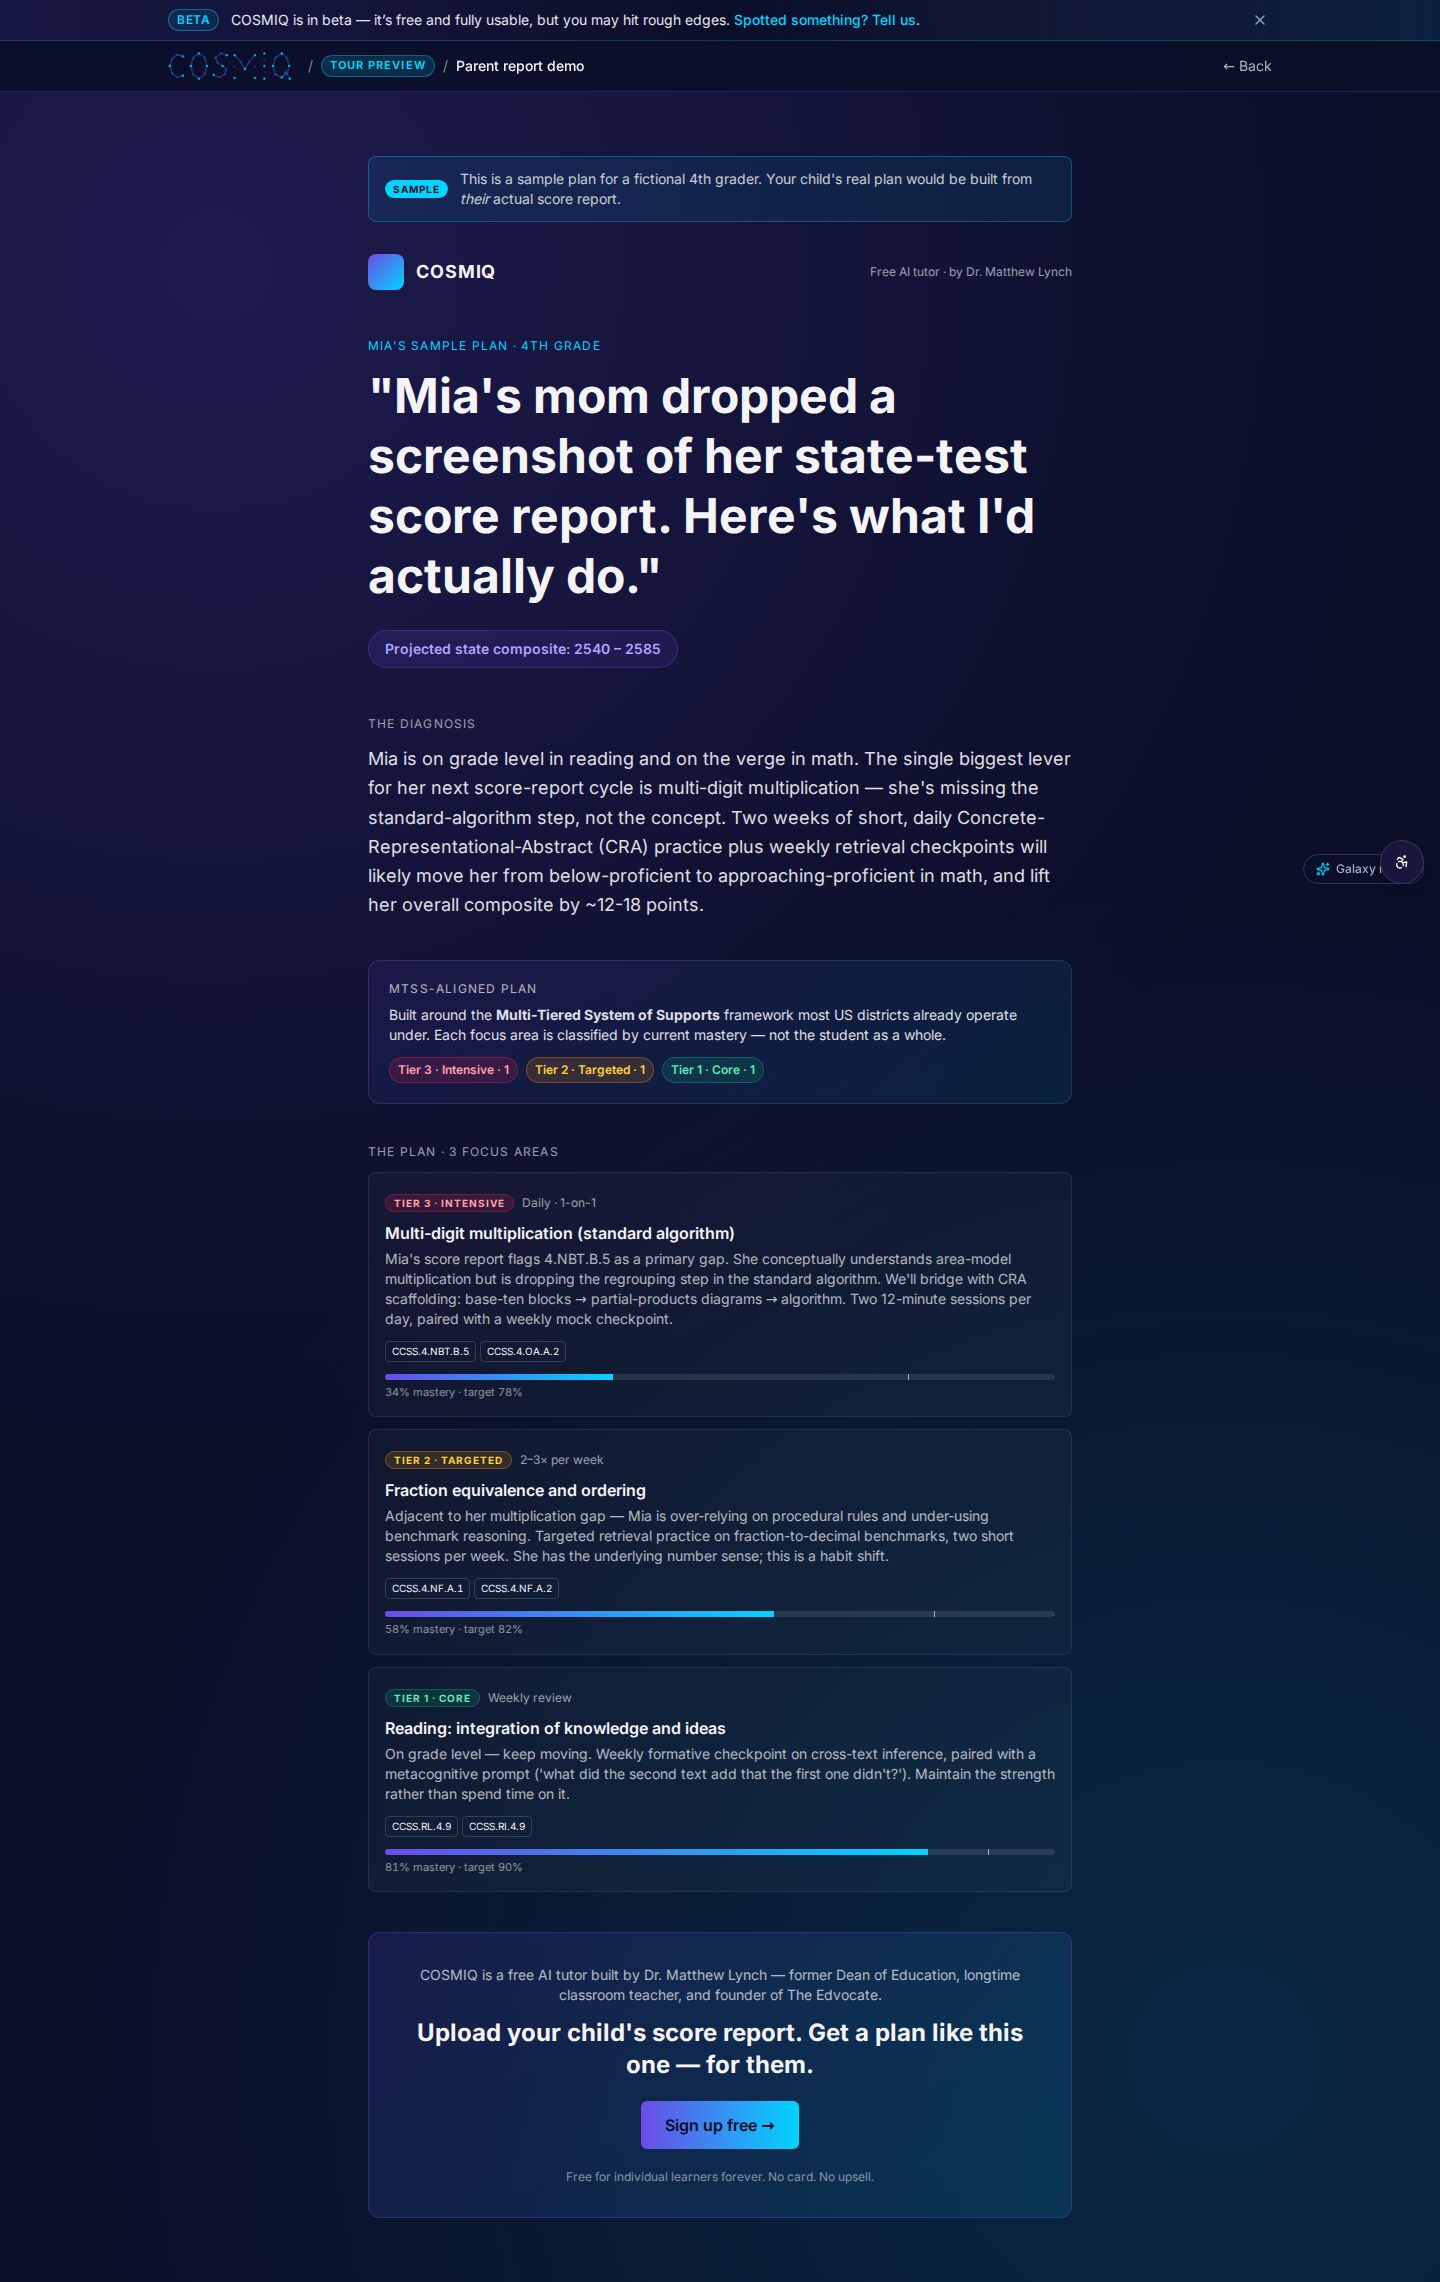
As a principal, you wear many hats. You’re an educator, a leader, a mentor, and often, a data analyst. The landscape of education is filled with numbers, trends, and often overwhelming amounts of information. But here's the thing: that data can tell a story. It can shape the direction of your school, impact student outcomes, and inform your decisions. Today, let’s explore how to navigate this data-driven world, especially focusing on how to transition from broad school-wide trends down to the individual student level.
Understanding Your Data Landscape
Before you can make sense of your students’ needs, you must first understand the landscape of data available to you. Schools collect a plethora of data in various forms. From standardized test scores to attendance records, from classroom participation to behavioral incidents, each piece plays a role in the bigger picture. However, simply having access to this data is not enough; you need to know what to do with it.
Take the principal student progress dashboard, for example. This tool aggregates various student data points into a single, coherent view. It allows you to see how each student is performing across different subjects and identify those who may be struggling. You can easily spot trends, like a dip in math scores across specific grades or identify groups of students who might need additional support.
Think about it: if you see a significant drop in reading scores, you might wonder if it’s due to ineffective teaching methods, lack of engagement, or possibly external factors like family issues. This is where the beauty of data comes in. Rather than simply reacting to scores, you can ask deeper questions, investigate, and identify root causes. For instance, is it the same group of students struggling, or is it widespread across the school? Knowing this enables you to take targeted actions.
Moving from Trends to Individual Needs
Once you’ve got a good grip on the school-wide trends, the next step is to drill in principal data to pinpoint individual student needs. This is where the magic happens. By focusing on the data for each student, you can tailor interventions that meet their unique challenges and strengths. But how do you effectively drill down into that data?
Start by using the intervention dashboard for principals. This tool can help you identify specific areas where students are struggling. For instance, if you notice a group of students consistently performing below grade level in reading, you can analyze their individual scores. Maybe they struggle with comprehension, or perhaps they have difficulty with phonetics. By identifying these trends, you can create targeted interventions, such as reading workshops or one-on-one tutoring, that directly address their needs.
But remember, it doesn’t stop with identification. Once you've determined which students need help, you must also track the effectiveness of the interventions you implement. Create a system to monitor progress over time. If a student is still struggling after a few weeks of extra support, it may be time to adjust your approach. This iterative process of evaluation is crucial. Consider using progress monitoring tools that complement the principal student progress dashboard, providing further insight into each student’s growth trajectory.
Engaging Teachers in Data Utilization
While you’re the one leading the charge, it’s essential to engage your teachers in the process. They’re on the front lines, interacting with students daily, and they possess invaluable insights that can complement the data you’re analyzing. Encourage them to use the tools at their disposal, like the principal student progress dashboard, to assess their students' performance. How often do they look at the data? Are they familiar with interpreting it?
Create professional development sessions focused on data literacy. Teach teachers how to navigate these dashboards, how to interpret findings, and how to apply these insights in the classroom. For example, if a teacher notices that a particular student is excelling in math but struggling in writing, they can adjust their teaching strategies, perhaps by pairing the student with a writing mentor, or providing additional resources tailored to the individual’s needs.
A great way to foster collaboration is through data-sharing sessions where teachers can discuss their findings together. Set aside time during staff meetings for teachers to present data on their classes and share successful interventions. Not only does this create a sense of community, but it also encourages a culture of continuous improvement.
Fostering a Data-Driven Culture
Creating a data-driven culture within your school doesn’t happen overnight. It requires consistent effort, communication, and a willingness to adapt. Begin by regularly discussing data at faculty meetings. Share successes and frustrations and encourage teachers to present their findings. Establish a culture where it’s okay to talk about student struggles openly.
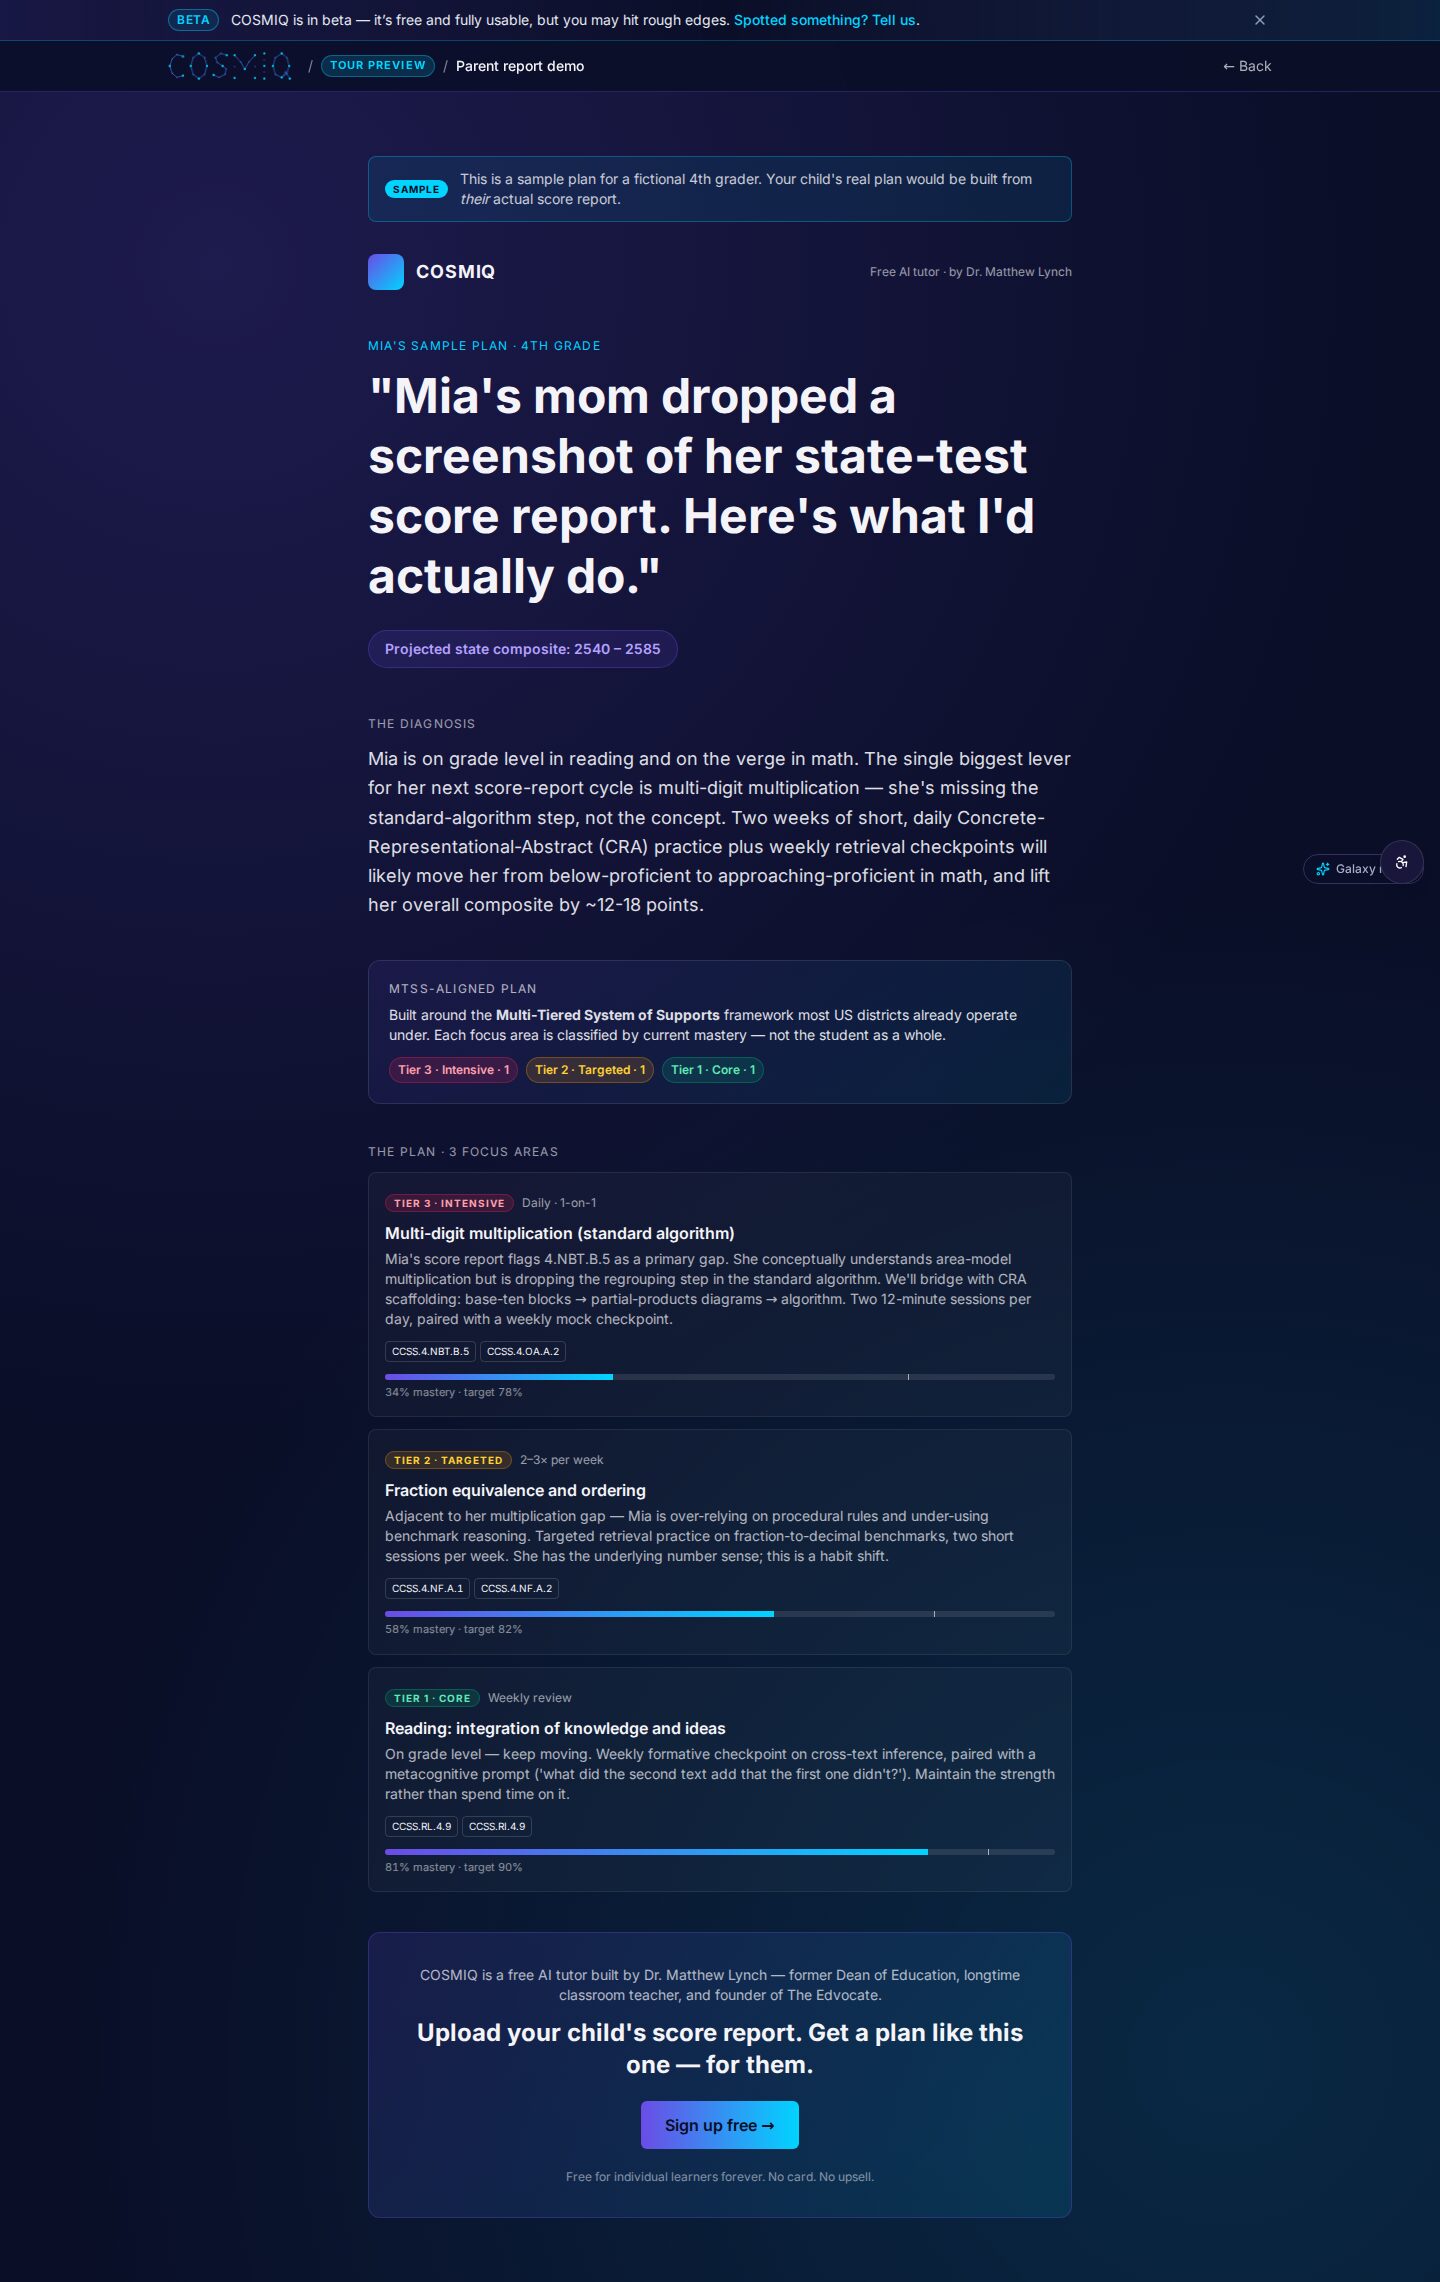
You might also want to incorporate data discussions into your parent-teacher conferences. Share with parents the overall performance trends you’re seeing in the school and specific areas of concern. When parents are informed, they’re more likely to support their child's learning at home. Plus, it builds trust and transparency.
Consider also creating a school-wide data day, where the entire faculty focuses on data analysis together. This could involve analyzing test scores, discussing attendance patterns, or examining discipline records. By making data a school-wide priority, you demonstrate its importance and encourage everyone to see themselves as part of the solution.
Addressing Equity and Access
In discussing data, it’s vital to consider equity. Not all students have the same access to resources, and that disparity can show up in your data. For example, students from low-income backgrounds may not have the same support at home for homework or tutoring. This is where the intervention dashboard for principals becomes crucial.
By analyzing data through an equity lens, you can identify which groups of students are consistently underperforming. Are they receiving the necessary support? Are there systemic barriers in place that need addressing? For instance, if you find that students with learning disabilities are falling behind, you can investigate whether they’re getting the right accommodations and supports. This might involve adjusting IEPs or increasing staff training on differentiated instruction.
Moreover, consider how your school can provide additional resources, such as after-school tutoring or partnerships with community organizations that offer academic support. Equity isn't just about identifying disparities; it’s about actively working to bridge those gaps. By focusing on these questions, you can create a more equitable environment that fosters success for all students.
Celebrating Successes
Data isn’t just about identifying problems; it’s also about celebrating successes. Take time to recognize students who are making strides, no matter how small. Use the principal student progress dashboard to highlight improvements in individual students or groups. This recognition can motivate not just the students who are performing well but also those who are struggling.
Celebrating success can also mean acknowledging the hard work of your teachers. If a certain class shows remarkable improvement due to a new teaching strategy, make sure to highlight that too. Perhaps you could create awards for ‘most improved students’ or ‘teaching champions’ to reinforce positive behaviors and outcomes. A culture of recognition fosters motivation, encourages continued effort, and reinforces your commitment to data-driven improvement.
You might even consider sharing success stories on your school’s website or newsletters. These stories can inspire other students and create a positive narrative around the use of data in the school. By spotlighting the journey of students who have overcome challenges, you not only celebrate their achievements but also provide relatable examples for other struggling students.
Taking Action: Next Steps
Now that you’re equipped with a better understanding of how to navigate school-wide trends down to the individual student level, what are your next steps? Begin by assessing your current data systems. Are they user-friendly? Do your teachers have the training they need to interpret and act on this data? This is where you can start making changes.
Consider setting up regular training sessions focused on data interpretation. Foster collaboration between teachers to share strategies and successes. And continually revisit your data tools. The goal should always be to refine your approach to ensure that it serves your students’ needs effectively. You want to create a cycle of ongoing improvement.
Remember, the data is there to help you. Whether it’s the principal student progress dashboard or the intervention dashboard for principals, utilize these tools to create a school environment where every student can thrive. Your ability to see beyond the numbers and connect them to individual student experiences will mark the difference in their educational journey.
Leveraging Technology for Data Management
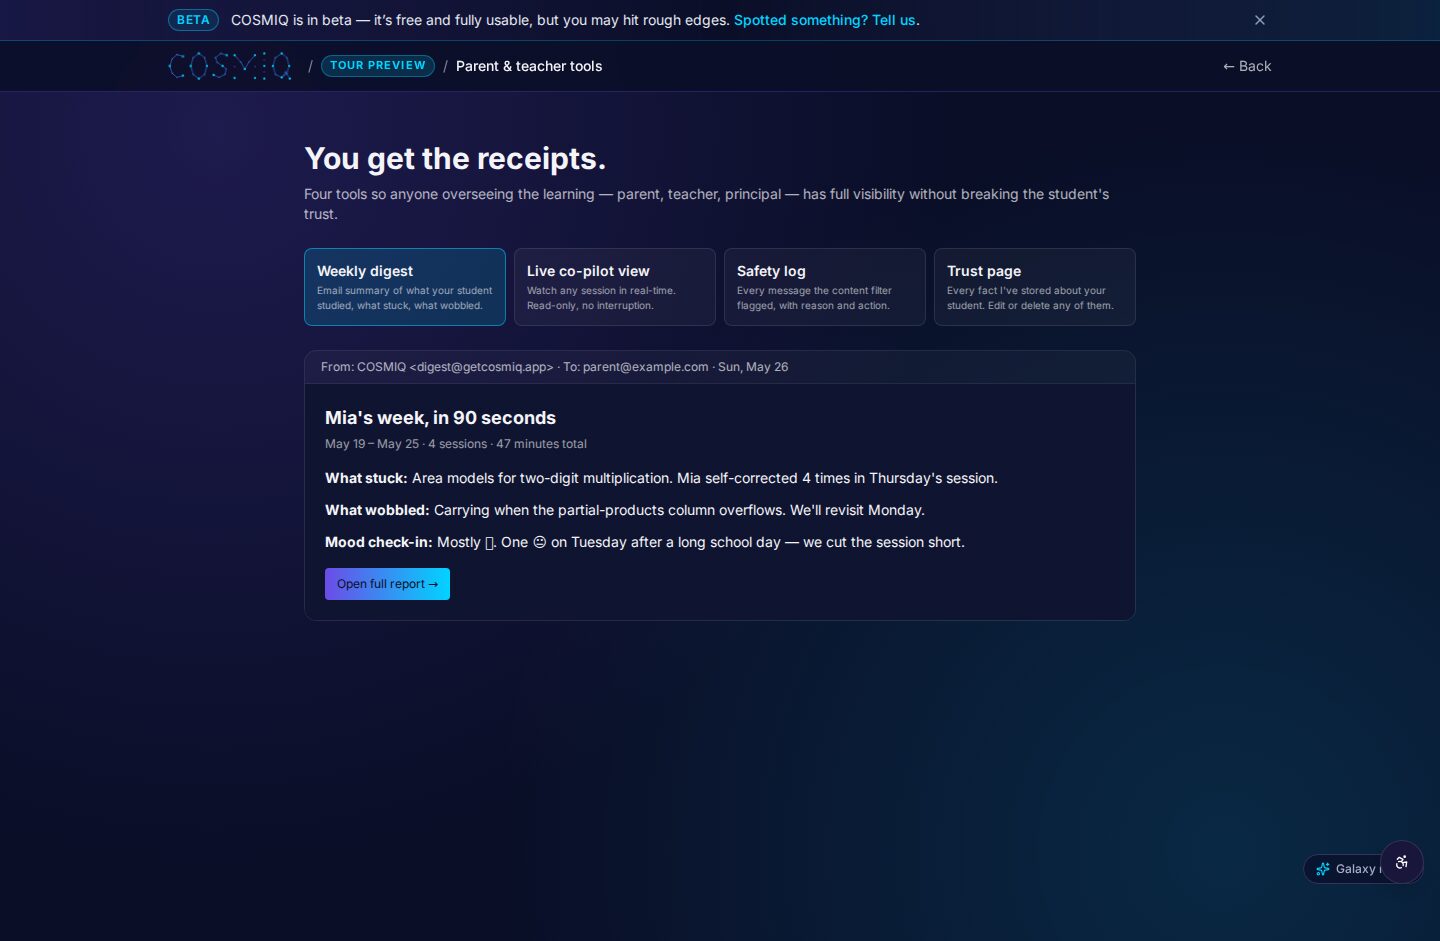
In our tech-savvy age, leveraging technology is imperative in efficiently managing and interpreting data. School leaders can utilize various software tools to streamline data collection and analysis. For instance, consider implementing platforms that integrate with your existing systems and allow for real-time data updates. This means you can access up-to-date information about student performance whenever you need it.
A good example is integrating Learning Management Systems (LMS) that allow teachers to input grades, track attendance, and even note student engagement levels. This data can feed directly into your principal student progress dashboard, giving you a more comprehensive view of each student’s overall performance. The beauty of technology lies in its ability to reduce administrative burdens, allowing educators to focus on what matters most: teaching and supporting their students.
Beyond just data management, technology can also enhance communication within your school. Using communication platforms can ensure that teachers, staff, and even parents are kept in the loop regarding student progress and school-wide initiatives. For instance, using apps that send alerts about a student’s significant academic changes can help you intervene swiftly, providing the necessary support before issues escalate.
Building Relationships Through Data Informed Conversations
Using data effectively isn't just about numbers; it's about people. Building relationships is key to a successful school environment, and data can help facilitate those relationships rather than hinder them. When you approach a teacher or a parent with data, focus on how it can help improve student outcomes. For example, instead of presenting data as a means to point out failures, frame your discussions around collaboration and support.
When discussing a student’s performance with their family, for instance, share specific data points that show both strengths and areas for growth. If a student is excelling in math but struggling in language arts, you can encourage parents to support their child’s learning at home by providing resources tailored to those subjects. Engaging parents this way helps them feel included and empowered to take part in their child’s education.
In conversations with teachers, emphasize the value of their insights and experiences. When you present data, ask for their input on how to interpret findings. This collaborative approach not only fosters trust but also cultivates a culture where everyone feels valued and part of the solution. Remember, data should never feel punitive; it should serve as a tool for growth and development.
Establishing Clear Goals and Accountability
To truly harness the power of data, it’s crucial to establish clear goals for your school based on the insights you gather. These goals should be specific, measurable, attainable, relevant, and time-bound (SMART). For instance, if your data indicates that reading scores are lagging, set a goal to improve those scores by a certain percentage over a given period.
Once you have these goals in place, accountability becomes essential. Make sure that everyone in your school—teachers, staff, and students—understands their role in achieving these goals. This might involve regular check-ins to assess progress towards the goals and adjusting strategies as needed. For example, if a particular intervention isn’t yielding results, be prepared to pivot and try something new.
Accountability can also extend to celebrating achievements along the way. When your school meets a milestone, take time to acknowledge the hard work that went into reaching it. Recognizing progress, no matter how small, can motivate your staff and students to keep pushing forward. By maintaining a focus on goals and accountability, you create an environment that is proactive rather than reactive, ensuring that student needs are continuously met.
Related resources: drill-in principal data · drill-in principal data
Learn anything, free.
COSMIQ is a free, voice-driven AI tutor for every learner. No credit card, ever.
Start learning free →