How the California Dashboard Works
Understanding the California Dashboard
The California Dashboard is a tool designed to provide clear and comprehensive insights into the performance of K-12 schools across the state. If you’re a parent, educator, or even a community member, understanding how this tool works can be incredibly beneficial. It’s not just a fancy website; it’s a resource that offers detailed information on various indicators of school performance. From academic achievement to school climate, the Dashboard aims to give you a full picture of how schools are functioning.
At its core, the Dashboard addresses the need for transparency and accessibility in education. The California education system is vast and complex, and the Dashboard breaks down this complexity into digestible and actionable insights. With an increasing number of parents and community members wanting to be informed about educational options, having a tool like this is central to promoting informed decision-making.
Key Features of the Dashboard
At its core, the California Dashboard includes several key features that allow users to assess school performance. One primary aspect is the academic indicators, which include test scores, graduation rates, and college and career readiness. The Dashboard also showcases metrics related to student engagement, such as attendance rates and suspension rates. These indicators help paint a fuller picture of a school’s effectiveness.
Another significant feature is the visual representation of data. The Dashboard employs color-coded performance levels—red, orange, yellow, green, and blue—to indicate how well schools are doing. This grading system simplifies complex data, making it easier for anyone to understand quickly. For instance, a school that receives a blue rating indicates exceptional performance, while red suggests significant challenges.
Let’s break this down further. When you access the Dashboard, you’re greeted by a visually intuitive interface that allows you to filter information based on your needs. This could include narrowing down your search by location, grade level, or specific metrics. For example, if you're particularly interested in schools with strong arts programs, you can filter schools accordingly and quickly find those that meet your criteria.
Additionally, the Dashboard offers comparative analysis tools, enabling users to juxtapose different schools’ performance data side-by-side. This is particularly useful for parents who are weighing options for their children or for educators looking to analyze trends in school performance across a district.
Navigating the Dashboard
When you first access the California Dashboard, you might find it a bit overwhelming. However, navigating it is straightforward once you get the hang of it. Start by selecting your desired school or district from the interactive map. Once you’ve chosen a school, you’ll be directed to a page that breaks down its performance across various metrics.
You can dive deeper into specific indicators. For example, if you want to know about academic performance, look for the section titled ‘Academic Indicators.’ Here, you'll find California school grades, including standardized test scores and other relevant details. This granularity allows you to compare schools easily, helping you make informed decisions about where to enroll your child.
If you want to explore more about a particular school's demographics, like the percentage of students receiving free or reduced-price meals or the breakdown of student ethnicity, the Dashboard provides easy access to that data. This information can help you assess whether a school’s environment aligns with your values and expectations.
Moreover, the Dashboard provides access to historical data, allowing you to track a school's progress over the years. This feature will enable you to see not only current performance but also trends that may indicate improvement or decline in certain areas. You can ask critical questions: Is a school getting better over time? Are the initiatives they are implementing showing positive results?
The Importance of the California School Report Card
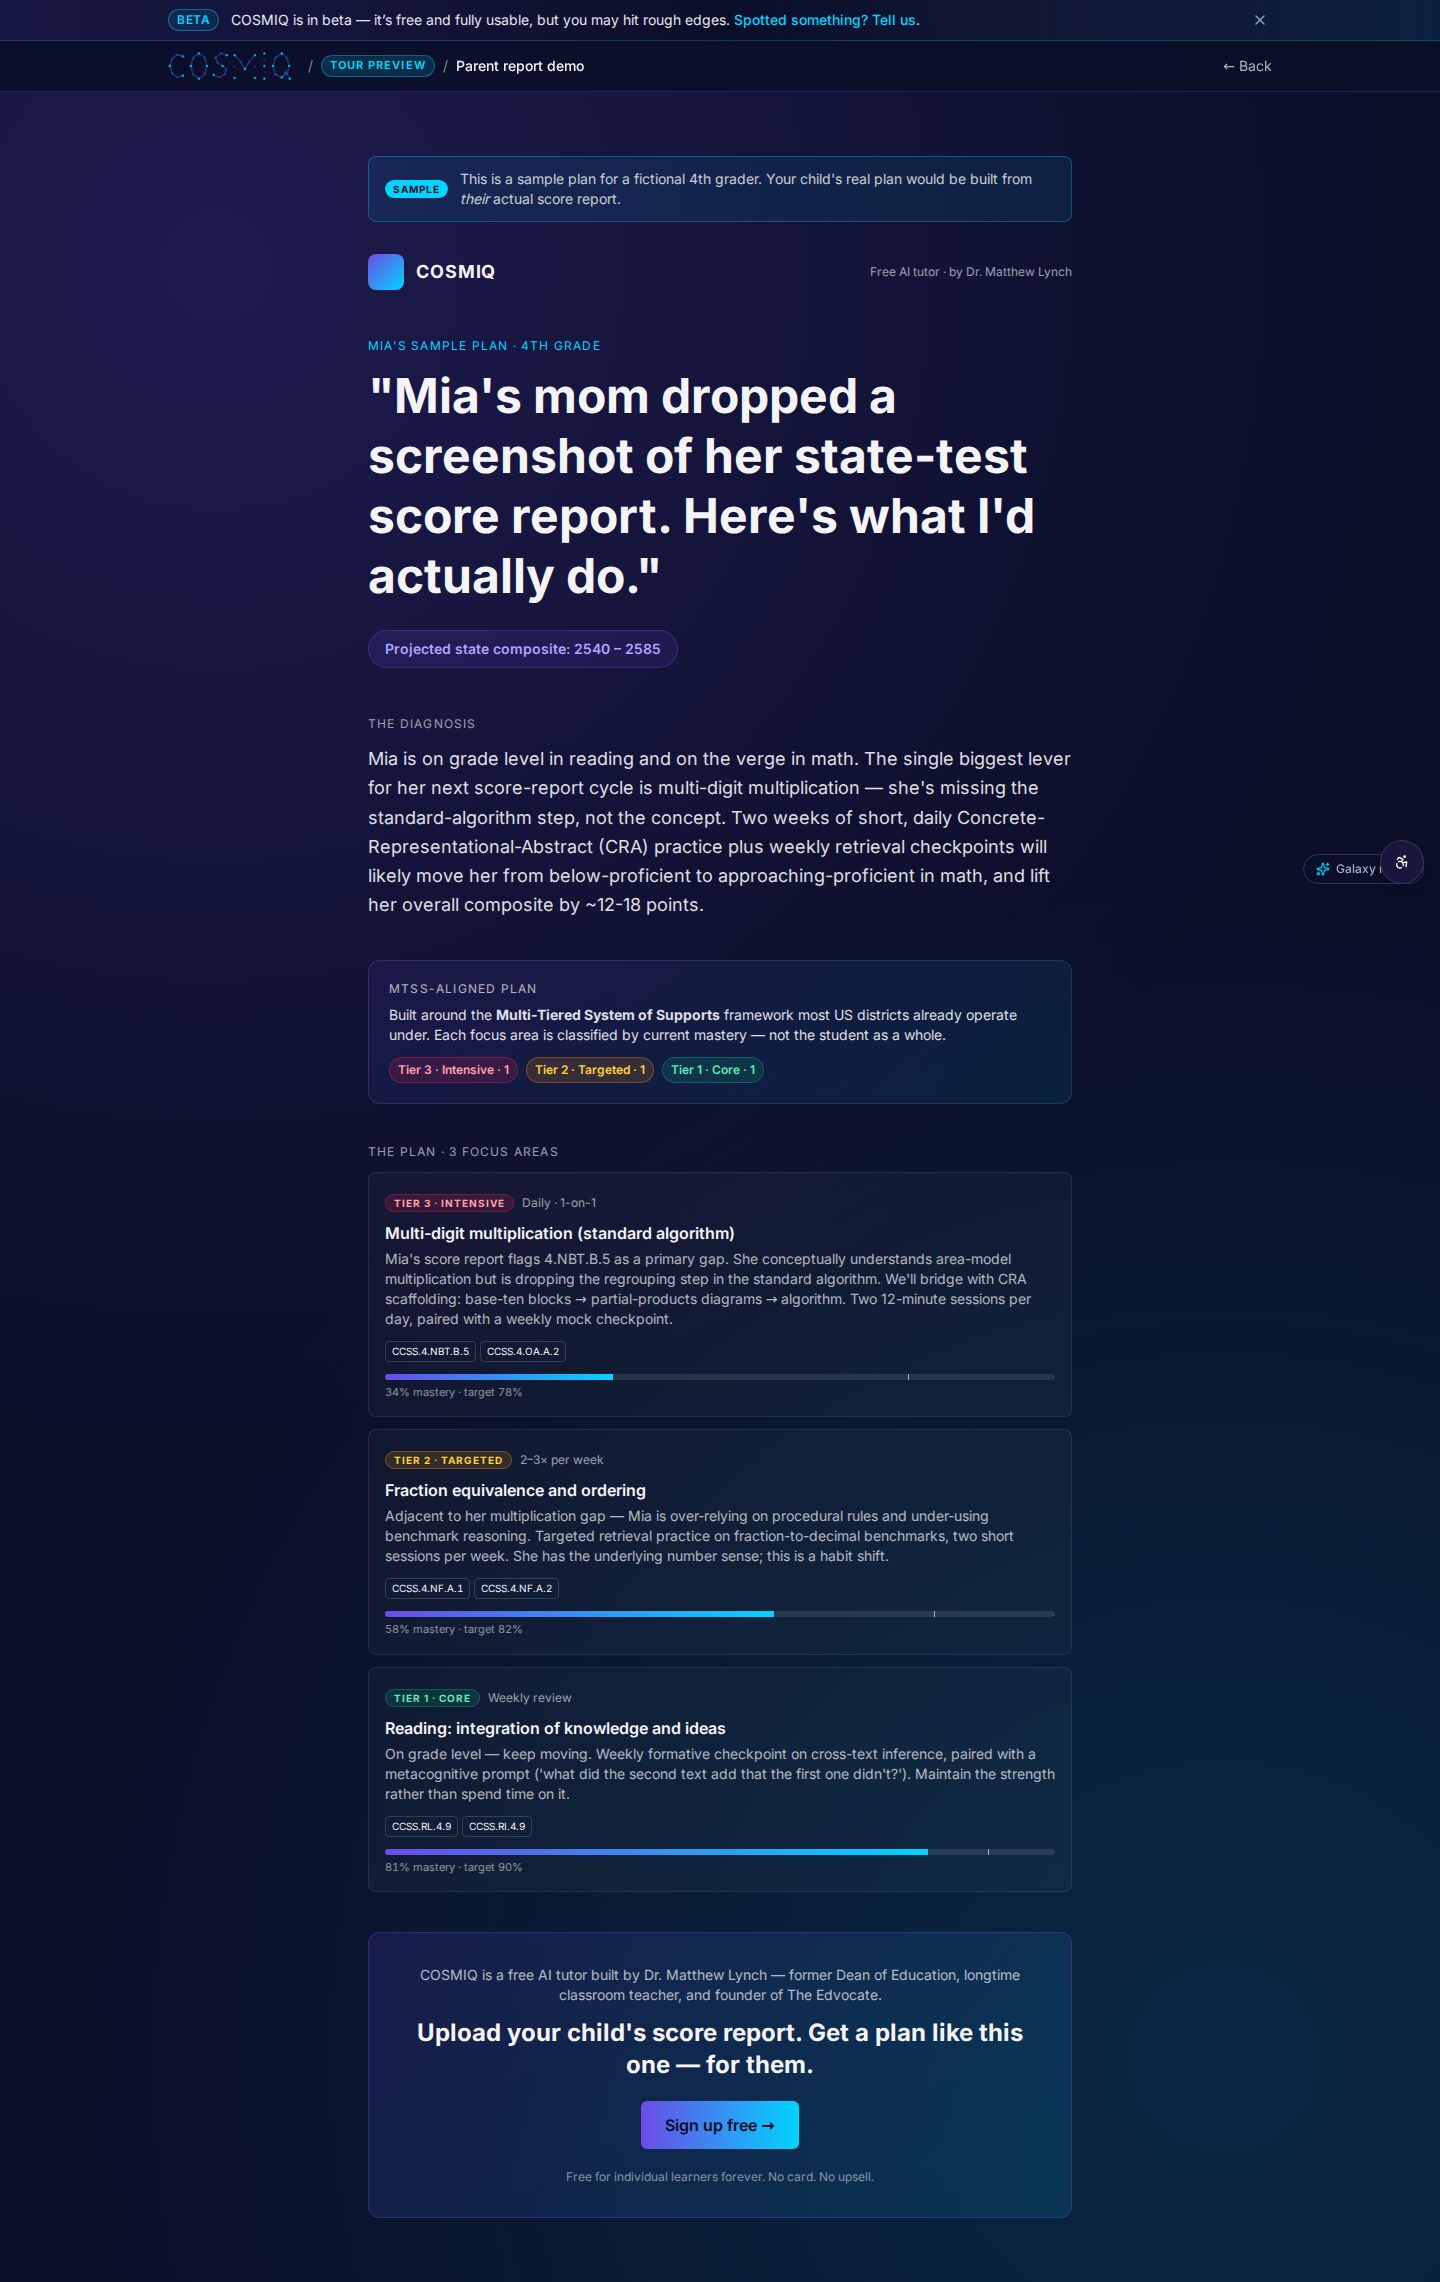
A vital component of the California Dashboard is the California school report card, which summarizes the performance of each school. This report card offers insights not just into test scores but also into other critical areas like student demographics, staffing information, and finance. For those who are serious about understanding schools in California, the report card is indispensable.
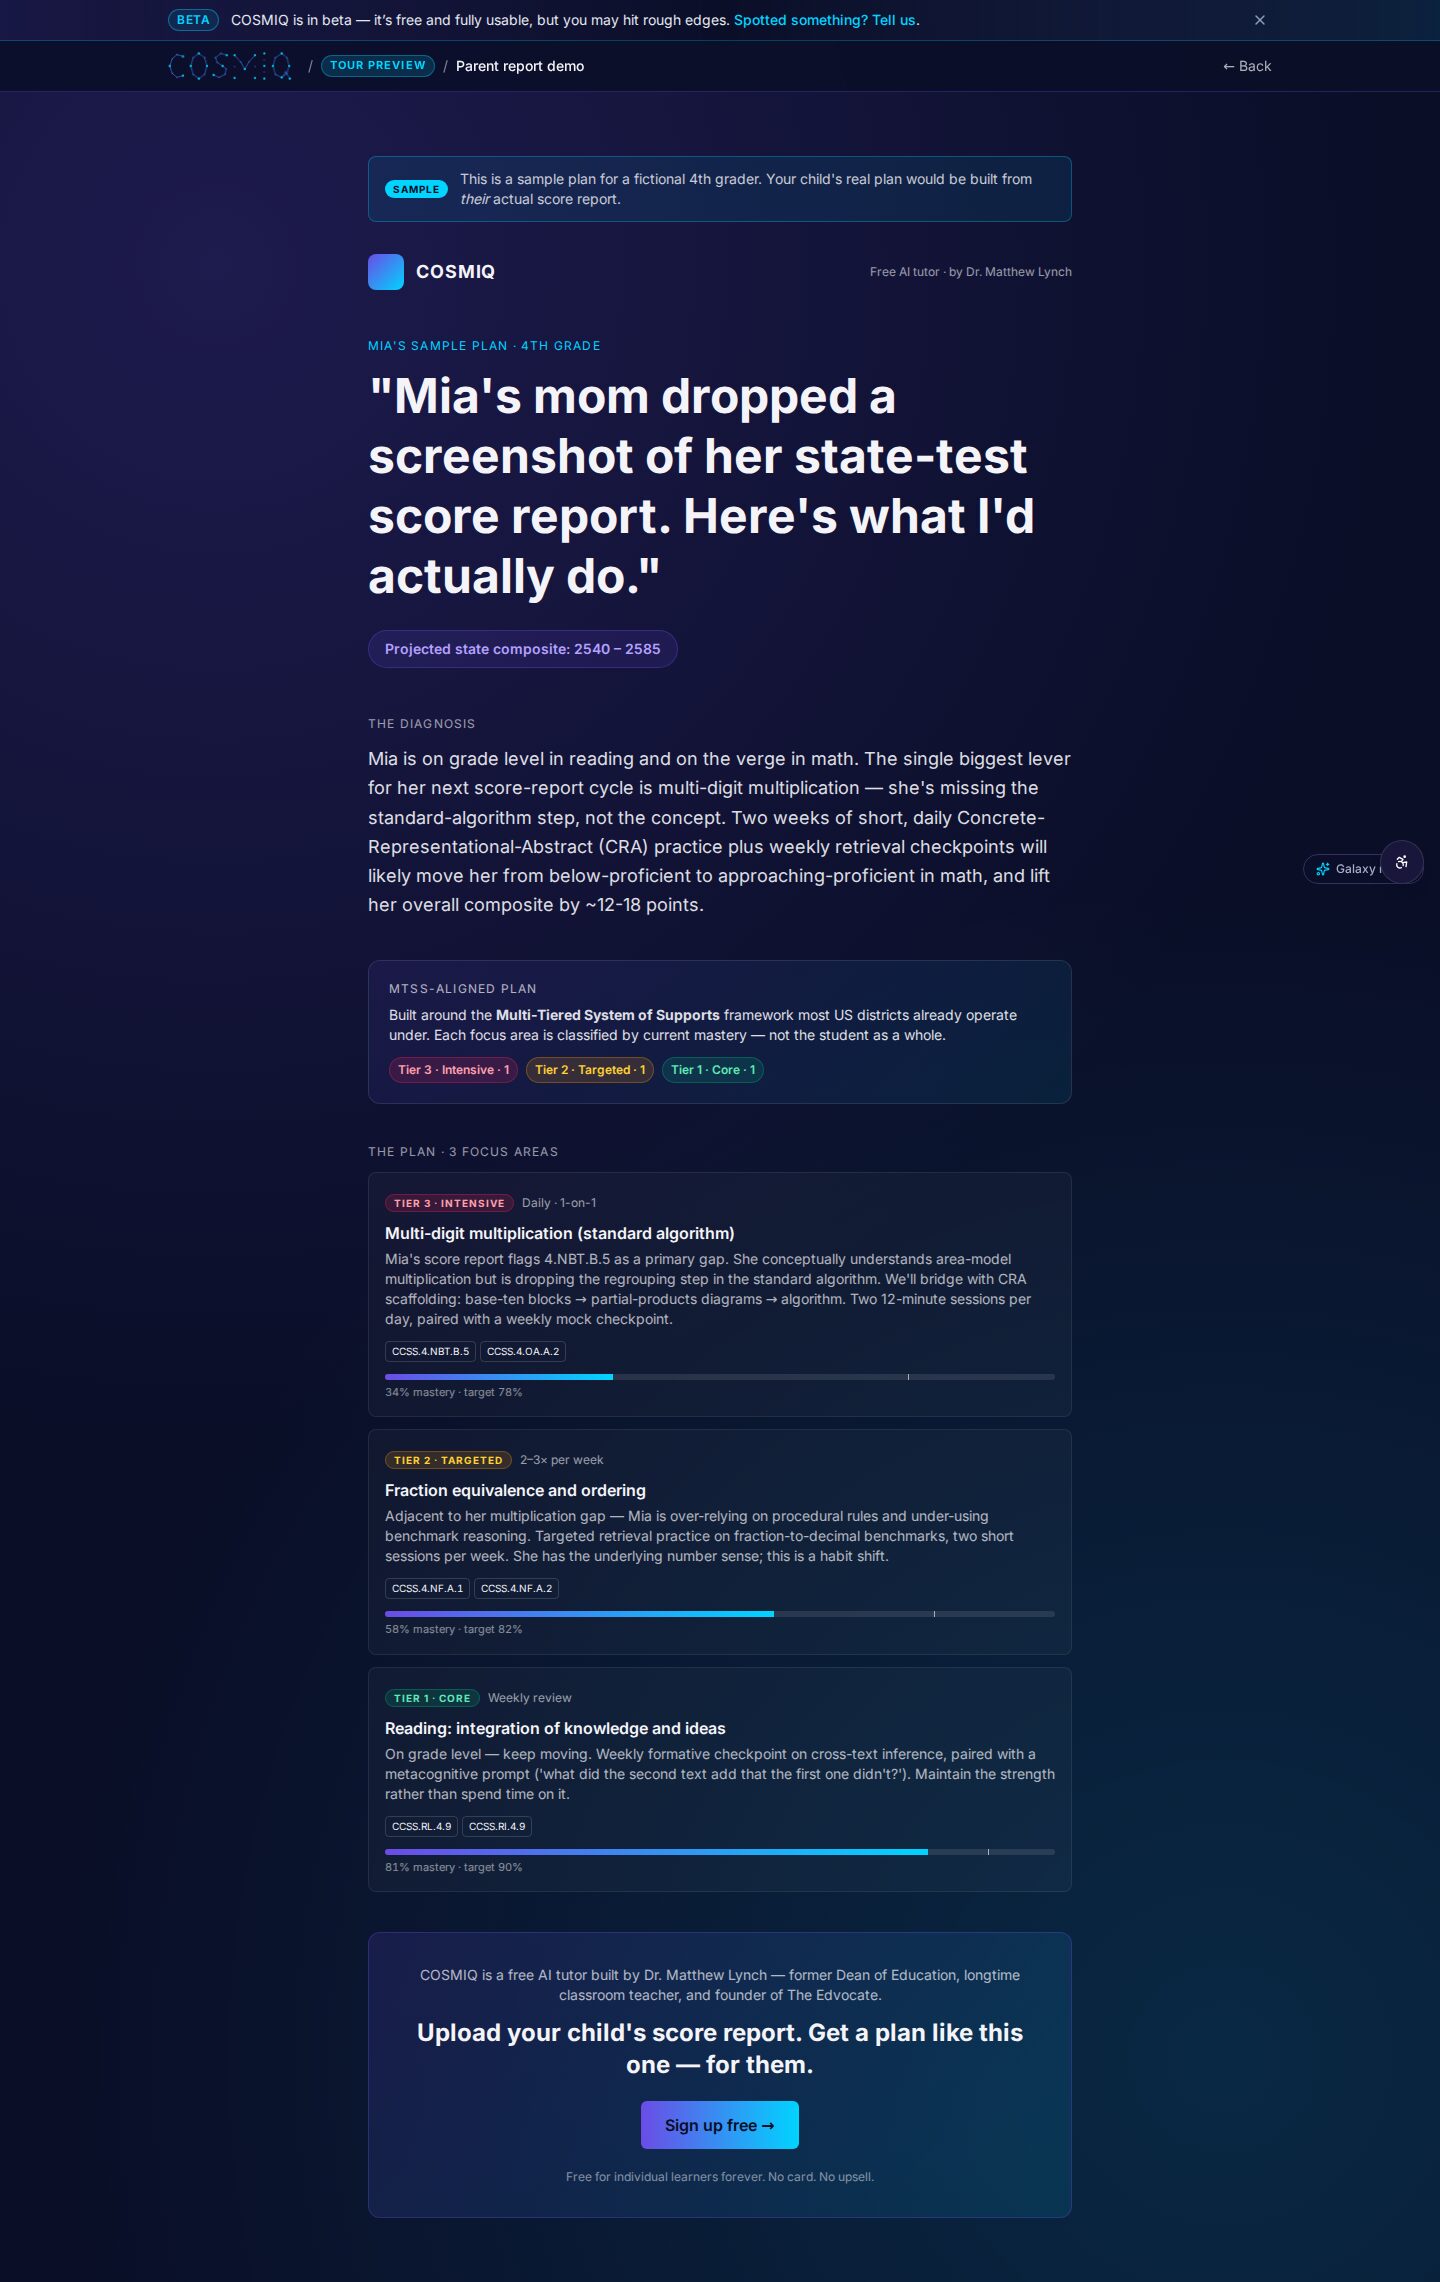
For instance, if you’re considering different options for your child, you could compare the report cards of two schools. Perhaps one school has higher test scores, but the other provides more extracurricular activities and a better student-to-teacher ratio. The school report card can guide your choice by giving you the data you need to weigh these factors.
These report cards are not only beneficial for prospective parents but also serve as a resource for stakeholders in education, including policymakers and community organizations. Local education authorities can analyze trends indicated in the report cards to allocate resources effectively, ensuring that schools in need receive the support they require.
The importance of these report cards extends to accountability, as they reflect how well schools serve their communities. By making this data public, schools are held accountable for their performance, and they can use the insights found in their report cards to promote transparency and trust within their communities. A transparent report card can also help strengthen partnerships between schools and local businesses or community organizations, creating a shared commitment to educational improvement.
Engagement and School Climate
The California Dashboard also highlights the importance of school climate and student engagement. You may have excellent test scores, but if students are unhappy or disengaged, the educational experience isn’t fulfilling. The Dashboard includes metrics such as suspension rates and attendance data, which serve as indicators of how students feel about their school environment.
Imagine two schools with similar academic scores: one has high attendance rates and low suspension rates, while the other struggles with both. You might prefer the first school, as it suggests a more positive atmosphere conducive to learning. This data is crucial for anyone looking to understand the full context of a school’s environment.
Additionally, understanding engagement goes beyond mere numbers. Schools that actively involve students in decision-making processes or offer clubs and extracurricular activities often report better engagement levels. When a student feels connected to their school, it often translates into improved academic performance. The Dashboard can help parents gauge this sense of belonging by looking at surveys or feedback from students.
It's also important to consider the role of teacher-student relationships in shaping school climate. Schools that foster strong, positive interactions between teachers and students tend to have more favorable climates. The Dashboard facilitates understanding these dynamics by including data on teacher qualifications and retention rates, helping you assess whether schools are adequately equipped to foster a supportive learning environment.
Using the Data for Improvement
Beyond just being a resource for parents and students, the California Dashboard serves a larger purpose. It helps educators and school administrators identify areas needing improvement. For example, if a particular school has low scores in English language arts, educators can investigate why and implement changes to boost performance.
Schools can also use the data to set goals. By tracking their progress over time through the Dashboard, they can make informed decisions about where to invest resources, whether that's additional tutoring, professional development for staff, or improved facilities.
Take, for instance, a school that notices a concerning downward trend in math scores. The data from the Dashboard could lead them to investigate their curriculum and instructional strategies. They might find that students need more hands-on learning experiences or that teachers require additional training in specific math teaching methodologies. Armed with this information, the school can then take actionable steps to address those gaps.
Furthermore, schools can collaborate with community organizations to enhance programs that directly impact student performance. For example, a school struggling with reading scores may partner with a local library for reading programs or enlist volunteers for tutoring sessions. The Dashboard helps schools identify these partnerships by showcasing community needs and how they align with educational goals.
Common Misconceptions About the Dashboard
Despite its many benefits, the California Dashboard isn’t without its misconceptions. Some people think it provides a simple grading system that can fully capture a school’s worth. While the color-coded system is helpful, it’s essential to remember that it reflects various metrics, and a single color shouldn’t be the sole factor in your decision-making.
Another misconception is that the Dashboard can only be useful for parents actively looking for schools. In reality, anyone interested in education policy, local community issues, or school improvement can benefit from the data. It’s a tool that can inform discussions on educational equity and resource allocation.
Additionally, many individuals mistakenly believe that the Dashboard focuses solely on academic performance, neglecting other vital aspects such as social-emotional learning and student well-being. While academic indicators are crucial, the Dashboard is designed to provide a holistic view of the educational landscape. Schools recognized for their commitment to student well-being often show improved academic outcomes, making it essential to consider all elements of a school's environment.
Lastly, some may perceive the Dashboard as static or unchanging. In reality, it is continuously updated to reflect new data and trends. This evolving nature means that users can rely on the Dashboard for current information that accurately represents school performance. Regular updates encourage schools to focus on sustained improvement and to adapt quickly to changing educational needs.
Future Developments in the California Dashboard
As technology advances and education evolves, the California Dashboard is also expected to undergo significant updates. One potential development could be the integration of real-time data tracking. Imagine being able to access live updates on student engagement, attendance, and even school events as they happen. This could provide even deeper insights for parents and educators seeking timely information.
Another exciting possibility is the inclusion of more qualitative data, such as student and teacher testimonials. While the Dashboard currently focuses on quantitative metrics, incorporating narrative elements could enrich the understanding of school climates and cultures. Personal stories about school experiences could provide context to the raw data, making it more relatable for parents and stakeholders.
Furthermore, community feedback mechanisms could be woven into the Dashboard to allow parents and students to share their views on school performance. This could help in recognizing non-measurable aspects of school quality, such as community involvement and parental satisfaction. Such feedback could ultimately guide schools in addressing their particular strengths and weaknesses.
Finally, as California continues to embrace educational equity, the Dashboard may evolve to better reflect issues of diversity, inclusion, and access. Additional indicators examining how well schools serve marginalized communities can help ensure that all students have equal opportunities to succeed. This evolution would align with broader educational reforms aimed at narrowing the achievement gap and promoting social justice.
Conclusion: A Resource for Everyone
The California Dashboard is a nuanced and effective tool that offers a wealth of information about school performance. Whether you’re considering which school is best for your child or you’re an educator aiming for improvement, it’s a resource you can’t afford to overlook. By understanding how to navigate the Dashboard and what each metric means, you’re empowering yourself and your community.
As you explore the California school report card and consider the various California school grades, keep in mind that this isn’t just data—it represents real students, real teachers, and real communities. So take the time to dig deep, ask questions, and engage with the information. Your understanding can lead to meaningful conversations about educational improvement and equity.
In the end, the California Dashboard is more than just a tool for data—it's a platform for change. By leveraging this resource, you can play an active role in shaping the future of education in California. Let’s use this information to advocate for our schools, support our educators, and ultimately, pave the way for a brighter future for every student.
Learn anything, free.
COSMIQ is a free, voice-driven AI tutor for every learner. No credit card, ever.
Start learning free →