The District Academic Dashboard for Aggregate Progress
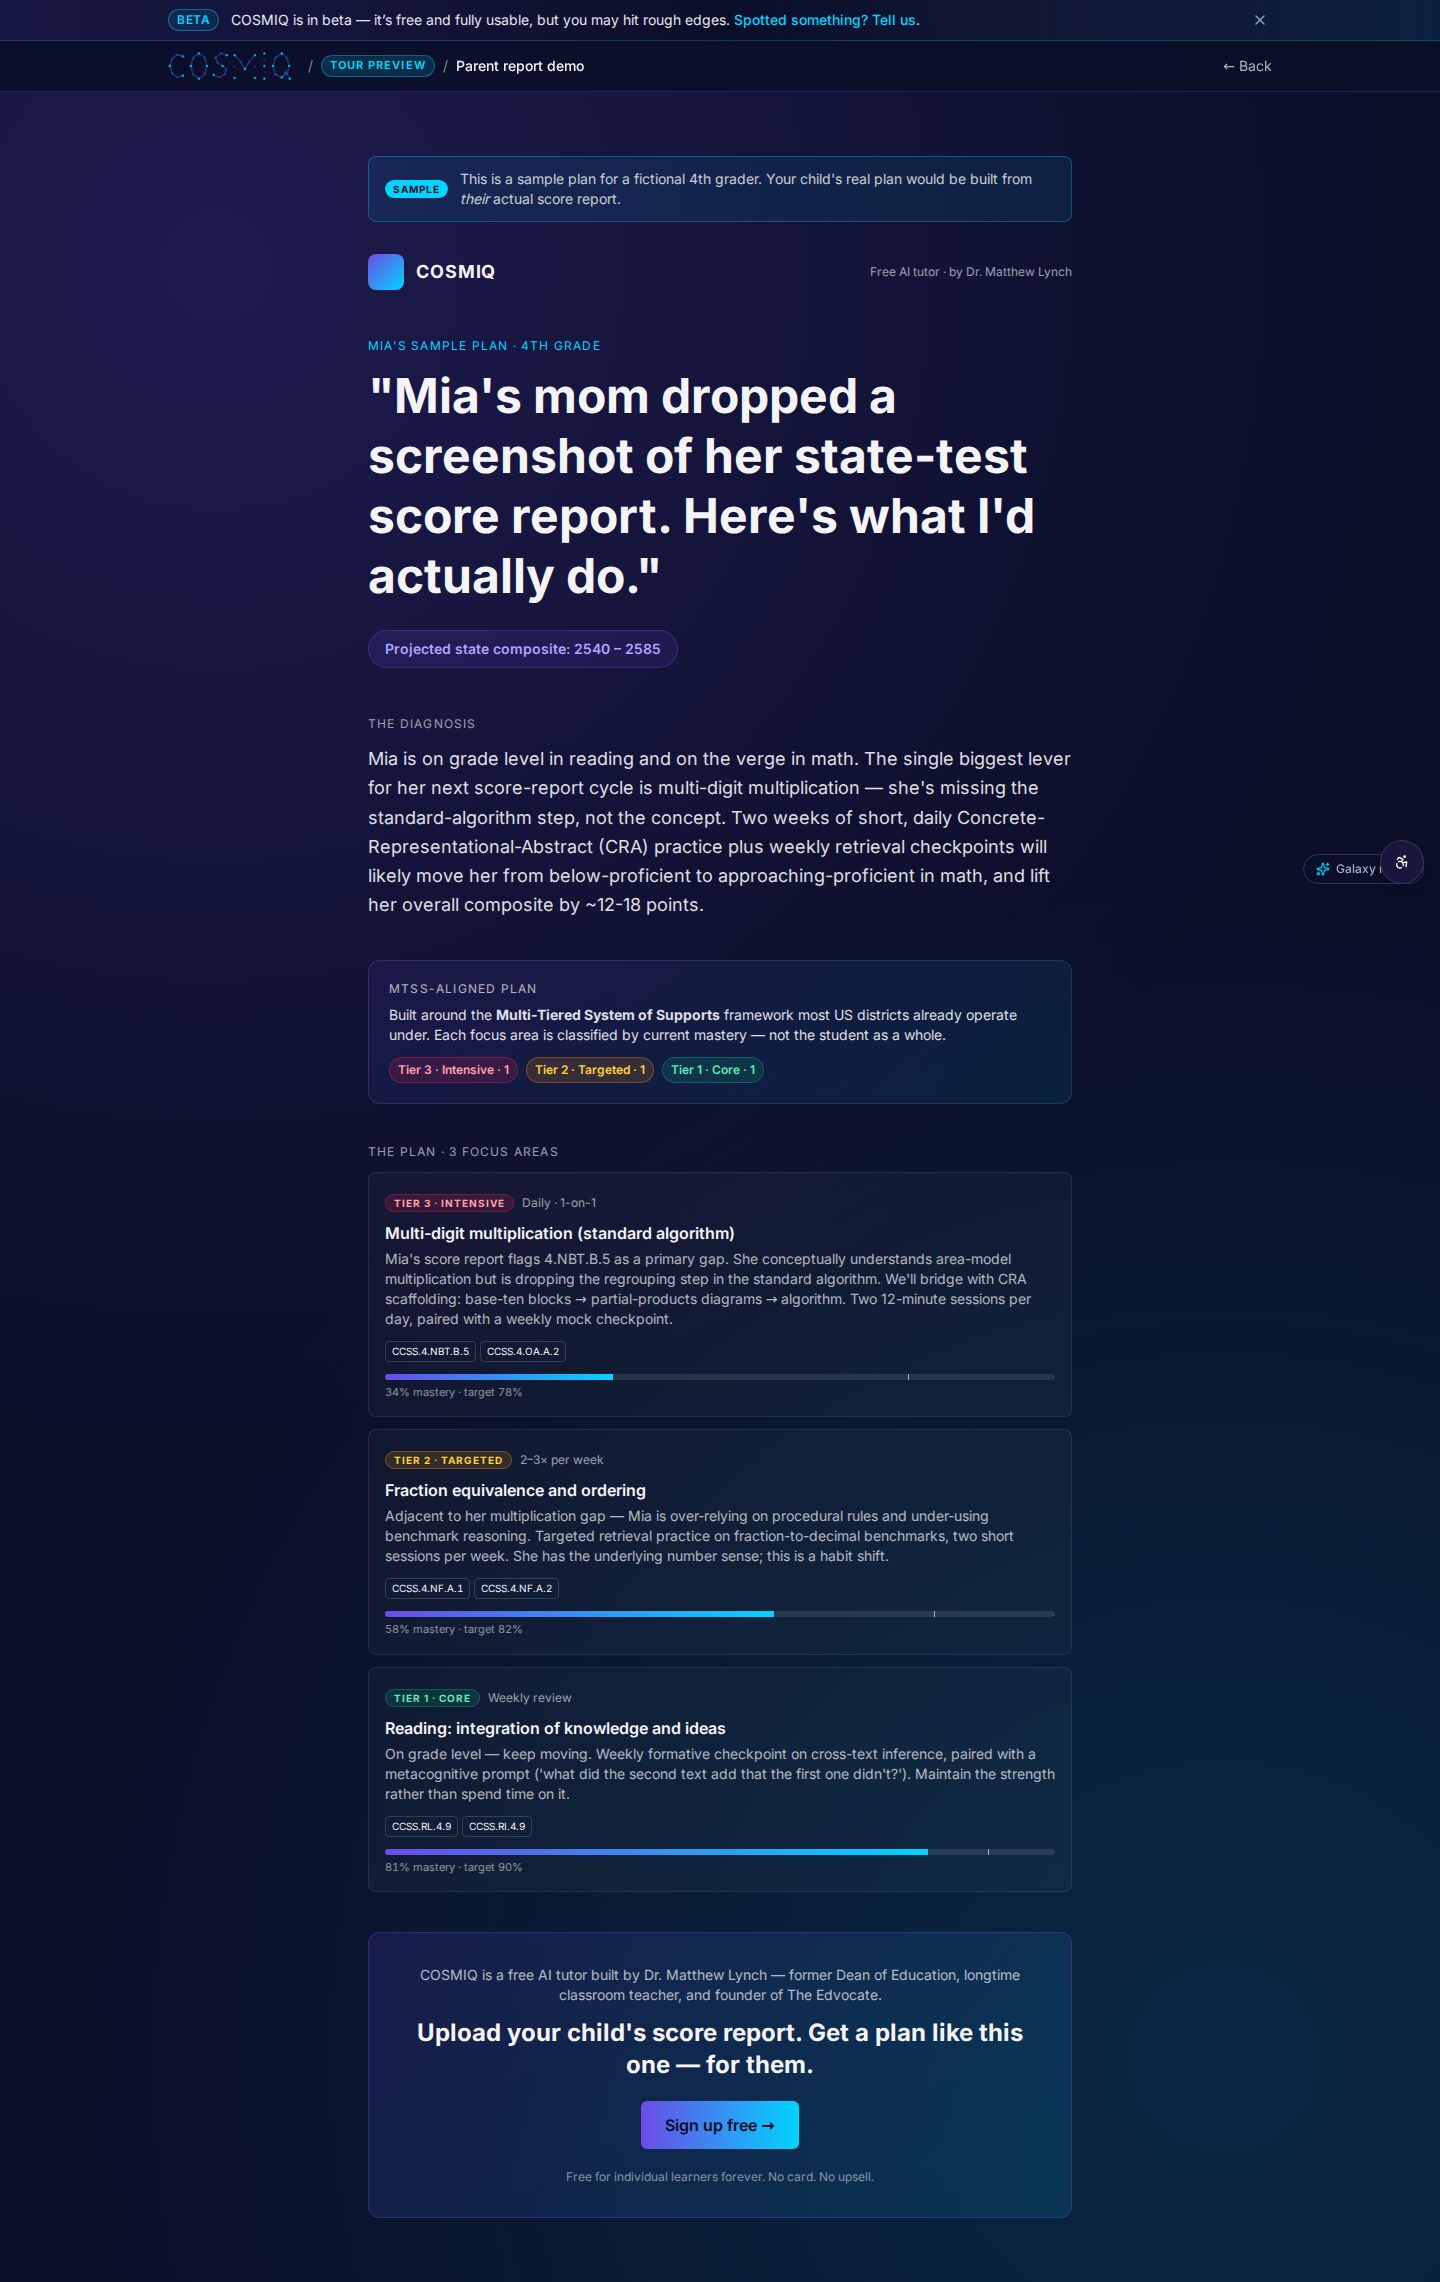
In today’s educational landscape, data-driven decision-making has become a cornerstone for enhancing student performance. The district academic dashboard serves as a vital tool for educators and administrators. It provides a visual representation of student performance metrics, allowing stakeholders to track aggregate progress over time. But how does this tool actually work in real-life scenarios? Let's break it down.
Understanding the District Academic Dashboard
A district academic dashboard is not just a fancy tool; it’s a comprehensive platform that aggregates and analyzes data related to student performance across various metrics. Think of it as a digital report card for an entire district. Rather than focusing on individual student grades, this dashboard offers a bird's-eye view of how each school within a district is performing. You’ll find metrics related to test scores, attendance rates, graduation rates, and even discipline referrals.
Why is this aggregation crucial? It helps educators identify trends and areas needing improvement. For instance, if one school consistently shows lower math scores compared to others, that’s a red flag. It opens the door for targeted interventions, which can be tracked through the district intervention rollup. Administrators can focus resources where they are most needed, leading to more effective educational strategies.
Moreover, the dashboard can provide a comparative analysis between schools within the district. For example, if one middle school excels in science while another struggles, that prompts not just a reaction but a proactive approach to share best practices. That’s what separates successful districts from those that are merely reactive; it’s the ability to engage with data in meaningful ways.
The Role of Data in Education
Data is a powerful component in education. When analyzed correctly, it reveals insights that can guide instructional strategies. With the district-level student progress information at your fingertips, educators can make informed decisions about curriculum changes, resource allocation, and even teacher training.
Let’s consider a scenario. A school district notices a significant dip in reading scores among third graders. Using the dashboard, administrators can drill down into the data to see if the issue is isolated to specific schools or grades. They might find that one school’s reading program isn't meeting the needs of its students. With this insight, they can implement targeted professional development for the teachers, ensuring they have the right tools and techniques to improve student reading levels.
Furthermore, the data analysis can extend beyond academics. Attendance rates are often intertwined with student performance. If the dashboard reveals that students with high absenteeism rates also have low grades, schools can take a closer look at the underlying causes—whether they're related to home life, health issues, or even bullying. Addressing these factors holistically can lead to improved academic outcomes.
Implementing Effective Interventions
Once the data is analyzed, it’s time to take action. The district intervention rollup is a critical aspect of this phase. It aggregates all the interventions being used across the district into a single view, allowing administrators to evaluate what’s working and what’s not. This process ensures that resources are allocated efficiently, and that students receive the support they actually need.
For example, if a school implements a new tutoring program but the district intervention rollup shows minimal improvement in student performance, it might be time to reassess. Is the program being implemented with fidelity? Are the right students being targeted? These are essential questions that can only be answered through careful monitoring of the aggregated data.
Additionally, consider the idea of continuous improvement. Schools should not only implement interventions but also review and refine them regularly based on the data collected. This creates a culture of accountability. For instance, if one school is successfully using a particular reading intervention, others can adopt and adapt it, sharing the successes and challenges faced along the way.
Real-World Applications and Case Studies
In practice, schools across the nation are tapping into the potential of the district academic dashboard. Take the case of a district in California that utilized its dashboard to address disproportionate suspension rates among minority students. By analyzing the data, educators found that specific disciplinary actions were disproportionately affecting certain student populations.
With this information, the district introduced restorative justice practices and modified their disciplinary policies. Within a year, they noted a significant decrease in suspension rates and an uptick in overall student engagement. The success of this initiative can be attributed to the actionable insights gleaned from the district academic dashboard.
Another compelling example comes from a school district in Texas, where the dashboard revealed that students in advanced placement (AP) courses were underperforming compared to state averages. By looking deeper into the data, educators found that many students lacked the preparatory resources necessary to succeed in these rigorous courses. The district then created summer workshops to better prepare students, resulting in a noticeable increase in AP exam scores the following year.
Engaging Stakeholders
When it comes to the district academic dashboard, communication is key. Educators, administrators, students, and even parents should understand the data being presented. Why? Because the more engaged the stakeholders are, the better the outcomes. For instance, schools that hold community meetings to discuss dashboard findings often see increased parental involvement.
This engagement can take many forms. Schools might share findings during parent-teacher conferences or through newsletters. For example, if the dashboard indicates that students are struggling with a particular subject, parents can be empowered to support their children at home. It’s a collaborative effort that ultimately benefits the students.
Moreover, involving students in the conversation can be highly effective. When students understand their own data, they can take ownership of their learning. Schools can host workshops where students learn to interpret their performance metrics. This empowers them to set personal academic goals and strive for improvement.
Challenges in Implementation
Despite its advantages, implementing a district academic dashboard is not without challenges. Data privacy is a significant concern. Schools must ensure that they are complying with regulations while still being transparent about student performance.
Additionally, there’s the issue of data literacy among educators. Not everyone is trained to interpret the data effectively. Professional development focused on data analysis can help bridge this gap. Schools need to invest time and resources into training staff, so they can utilize the dashboard to its fullest potential.
Another obstacle can be resistance to change. Some educators may be skeptical about new data-driven approaches, particularly if they’ve been relying on traditional methods for years. It's crucial to cultivate a mindset that values innovation and encourages experimentation with data tools.
Looking Ahead: The Future of Data in Education
The future of education lies in harnessing the power of data. As technology continues to evolve, so will the capabilities of dashboards like the district academic dashboard. Imagine predictive analytics, where educators can not only see past performance but also forecast future trends based on current data.
This kind of forward-thinking approach can transform how schools operate. Educators will be able to identify at-risk students before they even fail a test. Tailored interventions can then be put in place, ensuring that no student falls through the cracks.
Furthermore, as artificial intelligence and machine learning technologies advance, they can be integrated into dashboards to provide even deeper insights. These tools could analyze patterns in student behavior and performance, allowing for real-time adjustments to teaching strategies.
In the end, the district academic dashboard isn’t just a tool; it’s a lifeline for educational success. By understanding aggregate progress and leveraging data effectively, districts can make informed decisions that lead to improved outcomes for all students.

Building a Data-Informed Culture
Creating a data-informed culture within a school district is essential for maximizing the benefits of the district academic dashboard. This culture begins with leadership. Administrators must model data-driven decision-making and encourage all staff members to do the same. Regular training sessions should be held to enhance everyone’s data literacy, ensuring that understanding data becomes an integral part of the school’s ethos.
Additionally, schools should celebrate successes that arise from data-informed decisions. When a particular intervention leads to improved student performance, share that story widely. Highlighting these achievements not only boosts morale but also reinforces the idea that data can lead to tangible improvements in student outcomes.
Aligning resources and priorities around data is equally important. Schools should prioritize hiring staff and acquiring tools that emphasize data analysis. This alignment sends a message that data plays a crucial role in achieving the district’s educational goals, fostering a collaborative spirit among teachers who are all working towards the same outcomes.
Leveraging Community Partnerships
Another strategic angle is leveraging community partnerships to enhance the insights gained from the district academic dashboard. Local businesses, higher education institutions, and non-profit organizations can provide resources or expertise that schools might lack.
For example, a local university could partner with a district to analyze data trends and provide recommendations on effective educational practices. This partnership could yield rich insights that would be difficult for a district to achieve alone. Additionally, community organizations can help address non-academic barriers to student success, such as housing instability or mental health issues.
Moreover, engaging community stakeholders enhances the sharing of data and results with the public. By openly communicating progress and challenges, schools can foster a sense of accountability and trust within the community. This transparency can lead to increased support and resources, creating a beneficial cycle of improvement.
The Importance of Continuous Feedback Loops
Finally, establishing continuous feedback loops within the district academic dashboard is vital for sustained improvement. Regular assessments and updates on student progress should be built into the school calendar, allowing Administrators to review data frequently.
These feedback loops can also involve students and parents. Regular surveys can gauge student engagement and satisfaction with interventions. Parents can provide valuable insights about their child's experiences at home, which can inform the data. This multi-faceted approach helps create a comprehensive understanding of student needs.
Emphasizing reflection is also key. Schools should regularly analyze what’s working and what isn’t, and adjust accordingly. This culture of continuous improvement fosters resilience and adaptability, essential traits in today’s rapidly changing educational landscape.
Related resources: district-level student progress
Learn anything, free.
COSMIQ is a free, voice-driven AI tutor for every learner. No credit card, ever.
Start learning free →