The Principal Dashboard for Student Progress and Interventions
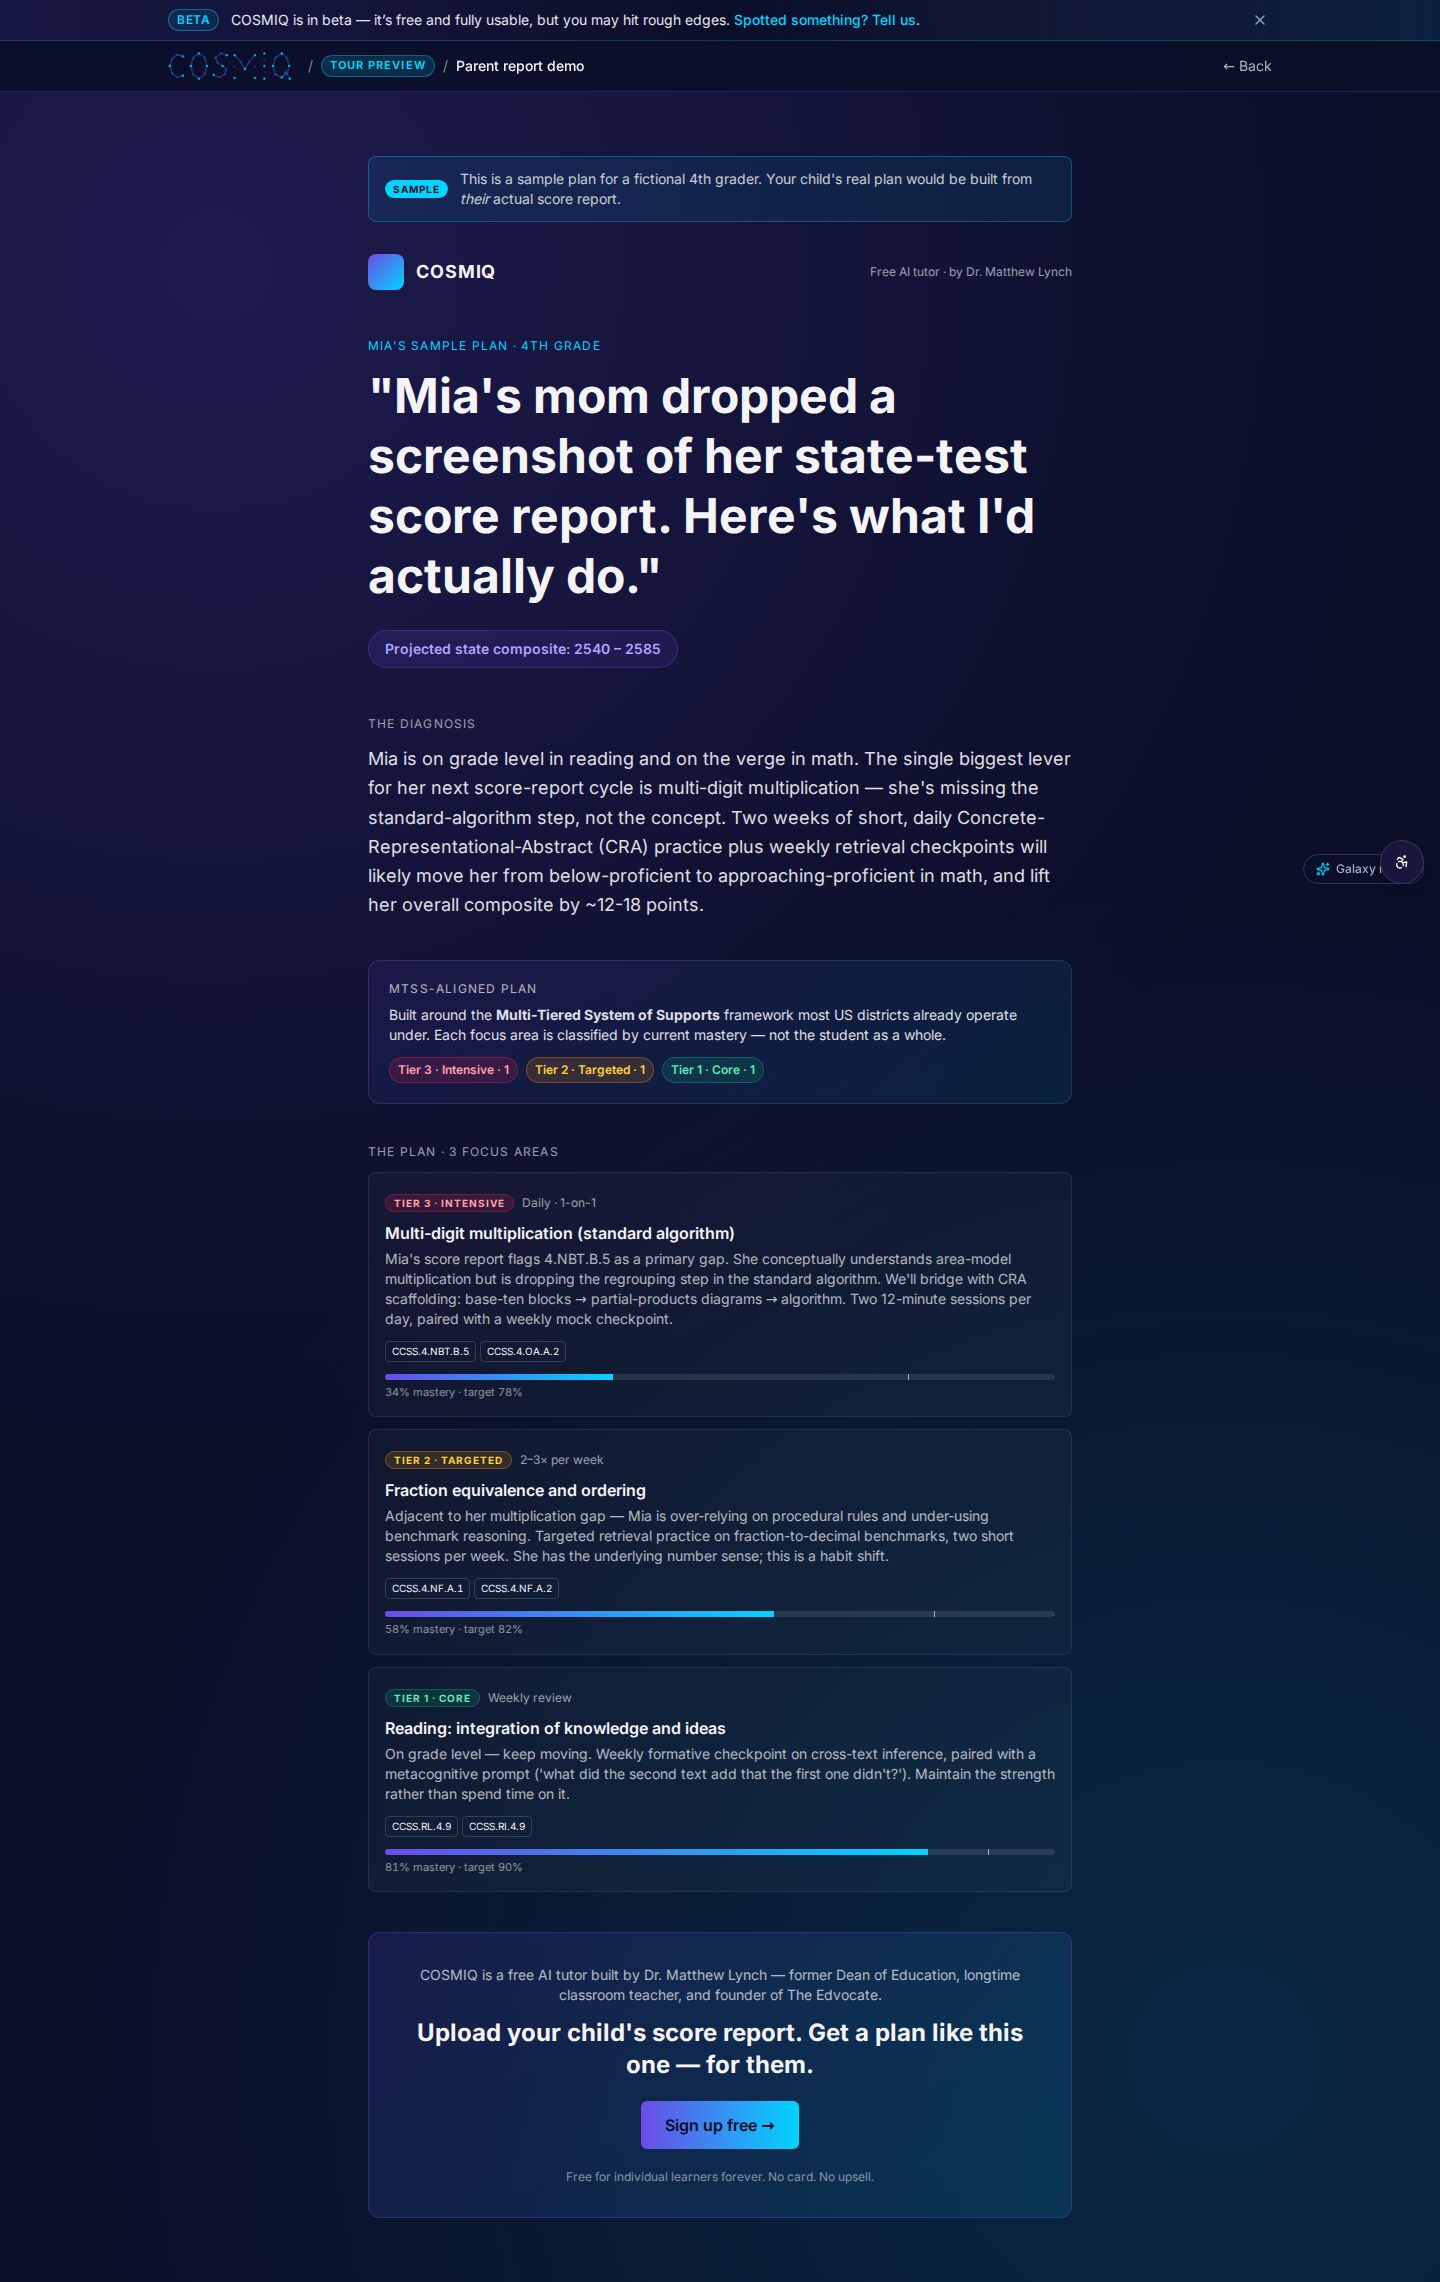
Navigating the intricacies of student progress and interventions can feel overwhelming for many school principals. With countless metrics to consider and a myriad of tools at your disposal, how do you ensure that you're making the best decisions for your students? This is where the principal dashboard for student progress and interventions comes into play. It’s more than just a tool; it’s your strategic partner in fostering student success.
Understanding the Principal Dashboard for Student Progress
At its core, the principal dashboard for student progress gives you a comprehensive view of student performance across various parameters. From academic achievements to behavioral trends, it enables you to visualize data in a way that's both informative and actionable. Think of it as your command center—one glance can tell you which students are excelling, who may be struggling, and where your resources are needed most.
This dashboard isn’t merely a passive display of numbers. It’s interactive, inviting you to explore different dimensions of student data. For instance, you can drill down into specific subjects or grade levels to see how particular demographics are performing. With this level of detail, you’re not just seeing the big picture; you’re also getting insights that can inform your strategies for intervention.
Imagine standing in your office, looking at the dashboard. You notice a red flag indicating that students in 7th-grade science are consistently performing below standard. Instead of waiting for the next assessment cycle, you can click on that data point. Instantly, you see which students are struggling, how long they’ve been struggling, and even the specific topics they find challenging. This interactive capability allows you to listen to the data and respond swiftly.
The Importance of Data-Driven Decisions
In today's educational landscape, making data-driven decisions isn't just a trend; it’s a necessity. When you rely on intuition alone, you might miss critical signals about student performance. The principal student progress dashboard transforms data into a narrative you can understand and act upon. It highlights trends over time, allowing you to adjust your approaches based on real evidence.
For example, let's say you notice a consistent drop in math scores among fifth graders. Instead of waiting for a formal assessment to confirm your suspicions, you can proactively initiate discussions with your teaching staff. By using the intervention dashboard for principals, you can identify specific areas within the curriculum that may need adjustment or additional support.
Consider a real-life scenario where a principal identified a downward trend in English language arts scores across multiple grade levels. By analyzing the principal dashboard for student progress, the principal discovered that a significant number of students were showing low comprehension levels during reading assessments. Armed with this awareness, the principal organized a series of professional development workshops focused on reading strategies for teachers. In just a few months, student scores showed improvement. This case isn’t just about numbers; it’s a powerful reminder that data can lead to meaningful change.
Analyzing Behavioral Trends
Academic performance is just one piece of the puzzle. Behavioral data can provide insight into the social-emotional aspects of student life, which often correlate with academic success. The principal dashboard for student progress can include metrics like attendance rates, disciplinary actions, and even student engagement scores. This holistic view is essential for understanding the full scope of each student's experience.
Consider a scenario where you see an uptick in absenteeism at a particular grade level. Instead of dismissing it as a seasonal issue, the dashboard allows you to investigate further. Are there specific classes where absenteeism is higher? Are certain students frequently absent? With the ability to drill-in principal data, you can pinpoint the root causes and craft targeted interventions. Perhaps it’s a need for increased mental health support or a scheduling conflict impacting attendance.
Analyzing this behavioral data can reveal patterns. For instance, if you find that students in a certain class are frequently late, it might be worth investigating the class schedule. Are students having difficulty transitioning between classes? Is there a lack of engagement with the subject matter that causes them to lose interest? By identifying these factors through the dashboard, you can implement changes that directly address the issues.
Implementing Targeted Interventions
Once you've identified areas that require attention, the real work begins—implementing effective interventions. The intervention dashboard for principals serves as a roadmap, guiding you through the process of planning and executing these initiatives. It can help you track the effectiveness of interventions over time, allowing you to pivot strategies based on what works.
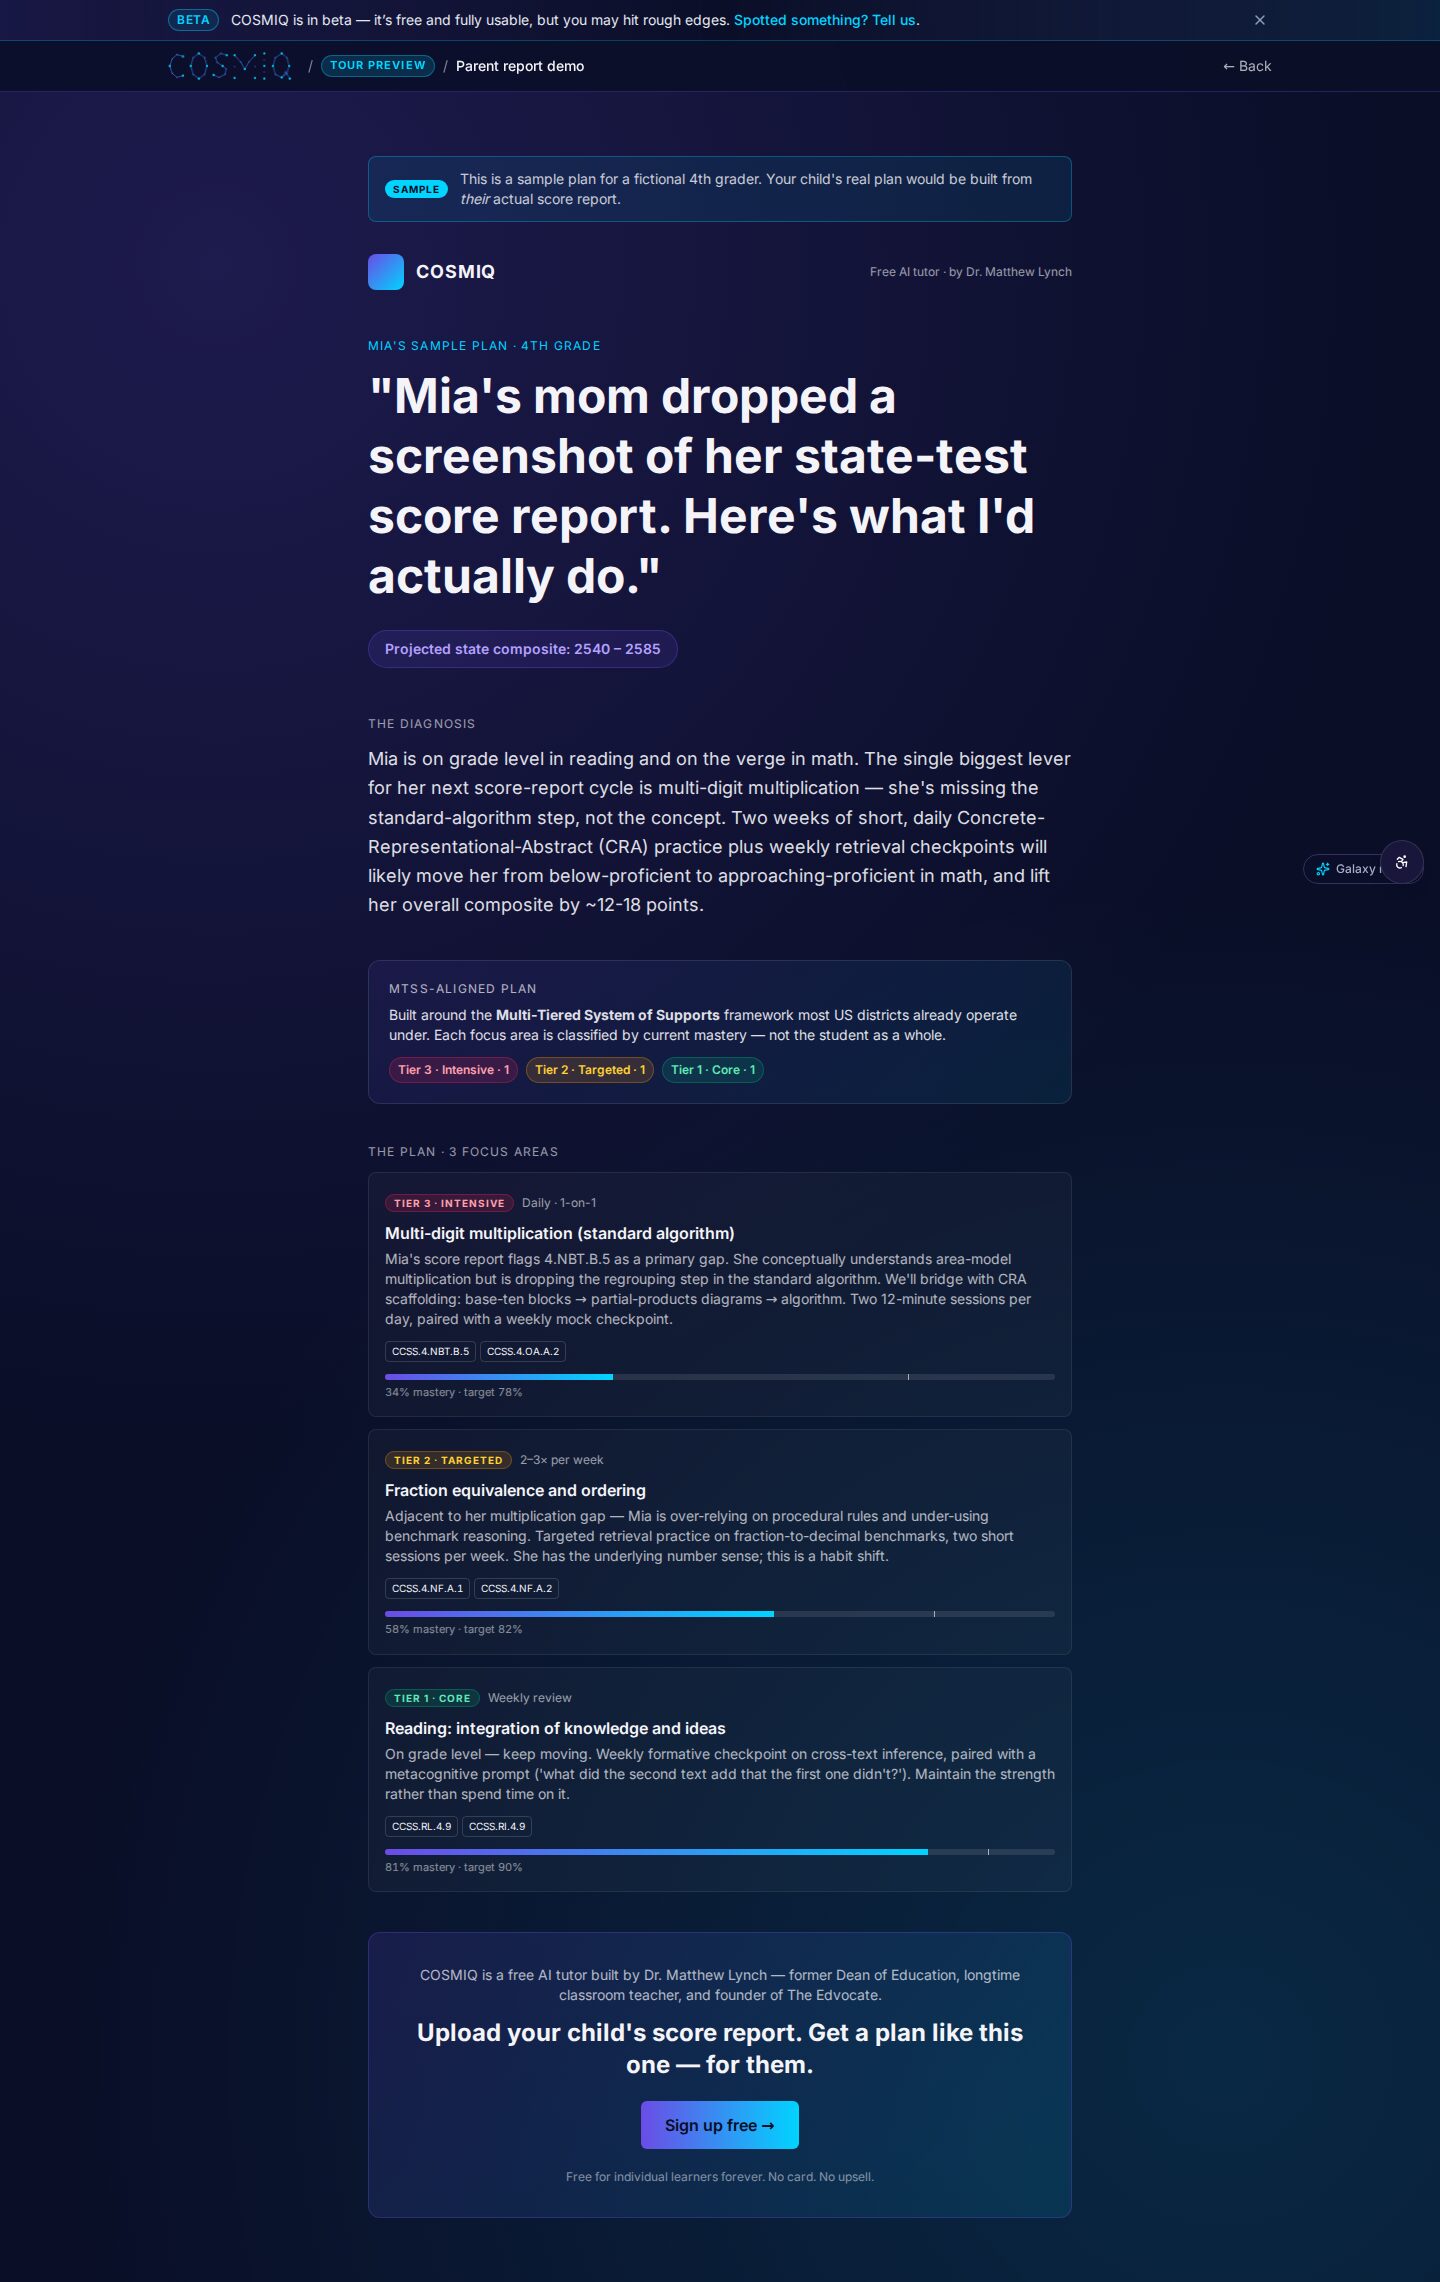
For instance, if you introduce a tutoring program for students struggling in reading, the dashboard can help you monitor not just attendance rates in the program but also changes in literacy scores. Are those students showing improvement? Are they more engaged in class? By continuously tracking these metrics, you can adjust your program in real time, ensuring that your interventions are as effective as possible.
Imagine you're implementing a new math intervention following insights gained from the dashboard. You roll out a two-month program focusing on foundational skills for struggling students. During this period, the dashboard allows you to monitor attendance and engagement levels. If students aren’t attending the sessions regularly, you might need to reassess the timing or the incentives for participation. After two months, you can analyze post-intervention assessment results to see if the program had the desired effect. If scores improved for the targeted group, you can then consider expanding the program. If not, the dashboard gives you the data to re-evaluate and pinpoint where adjustments should be made.
Collaboration and Communication with Staff
Your dashboard isn't only beneficial for you; it’s a powerful tool for communicating with your staff as well. When teachers can see the same data you see, it fosters a collaborative environment focused on student success. You can use the principal dashboard for student progress in staff meetings to highlight achievements and areas needing attention, promoting a culture of data literacy.
Imagine discussing the dashboard during a staff meeting. Each teacher can share insights based on their subject area, contributing to a collective understanding of student progress. This collaboration can lead to richer discussion around best practices and shared strategies for intervention. The more informed your staff is, the better equipped they are to support their students.
Additionally, the collaborative aspect goes beyond just sharing data. It involves creating action plans together based on insights from the dashboard. For example, if a particular grade level shows significant gaps in mathematics, you can work together to create targeted professional development sessions for teachers, focusing on differentiated instruction techniques. This collective approach not only improves teaching strategies but also enhances the overall efficacy of interventions across the school.
Engaging Families and the Community
Lastly, the principal dashboard can extend beyond the school walls. Engaging families and the community in understanding student progress is crucial. With the right insights from the dashboard, you can create targeted communication strategies that inform parents about their child's performance and areas of concern.
Let’s say you’re implementing a new math intervention. You can use data to create informational sessions or newsletters to educate families on how they can support their children at home. Sharing successes, such as improved test scores or enhanced classroom participation, can build trust and encourage parental involvement. The more engaged families are, the more likely students are to succeed.
Imagine hosting a series of workshops for parents, where you share insights from the dashboard. You could demonstrate how to interpret their child’s progress reports, delve into the data that informs teaching practices, and share strategies for at-home support. This kind of transparency fosters a strong home-school connection that is vital for student success.
The Future of Principal Dashboards
As technology continues to evolve, so too will the capabilities of principal dashboards. We’re on the brink of exciting advancements that can further personalize the data experience for educational leaders. Imagine dashboards that integrate artificial intelligence to predict student outcomes or identify at-risk students before problems arise.
The potential is vast. It’s not just about tracking data; it’s about using that data to create a proactive approach to education. As these tools advance, what will that mean for you as a principal? It means you'll have even more power to shape the educational landscape in your school.
Consider the implications of real-time analytics. What if you could receive alerts when a student’s performance drops below a certain threshold, allowing you to intervene before failure becomes inevitable? With advancements like predictive modeling and machine learning, the dashboard could analyze patterns and trends over time, giving you insights that were previously unimaginable.
This shift towards a more data-driven, proactive approach means that as a principal, you’ll need to stay abreast of these evolving technologies. It’s about more than just using the dashboard; it’s about embracing a culture of continuous improvement, where data is a key driving force behind policy and practice.
In the end, the principal dashboard for student progress and interventions is not just a tool—it's a pivotal component in the quest for educational equity and excellence. By leveraging its insights, you can make informed decisions that have a lasting impact on your students’ lives.
Building a Culture of Data Literacy in Schools
One of the most significant advantages of the principal dashboard for student progress is the potential to foster a culture of data literacy within your school. It’s not enough for you, the principal, to be data-savvy; your entire educational team must understand how to interpret and utilize data effectively. This involves ongoing training and professional development.
You might start by establishing regular data meetings with your staff, where you can review dashboard insights together. These meetings should be structured to encourage open dialogue about what the data reveals and how it can inform teaching practices. If a teacher identifies a particular trend in their classroom, they should feel empowered to share their insights and collaborate with others on potential solutions.
Furthermore, providing teachers with resources—such as workshops on using data analytics tools—can enhance their confidence in interpreting student performance metrics. The more skilled your staff becomes at engaging with the data, the more impactful your interventions will be. It's about creating a community of professionals who are committed to continuous improvement and student success.
Measuring Success Over Time
The principal dashboard for student progress isn’t just about collecting data; it’s also about measuring success over time. You need to establish metrics that go beyond immediate assessments and look at long-term student outcomes. This could mean tracking graduation rates, college acceptance rates, or even student retention in advanced courses.
To effectively measure success, create a timeline for assessment. For example, if you introduce a new intervention, plan to review its impact after a semester and again at the end of the academic year. Compare the data from those intervals against historical performance to gauge the effectiveness of your initiatives.
Additionally, involving students in this process can be powerful. Encourage them to set personal goals based on their data. For instance, if a student is struggling in science, help them identify specific actions they can take to improve, such as attending extra help sessions or participating in study groups. When students are engaged in their own progress, they become active participants in their learning journey.
Ultimately, the principal dashboard for student progress and interventions is designed to empower you, your staff, and your students. By analyzing trends, implementing targeted strategies, and fostering a culture of collaboration, you can transform your school into a data-informed learning environment where every student has the opportunity to thrive.
Related resources: principal student progress dashboard · drill-in principal data
Learn anything, free.
COSMIQ is a free, voice-driven AI tutor for every learner. No credit card, ever.
Start learning free →